
Transform at the rate it arrives — and know when nothing does.
A serverless data-transformation pipeline on AWS Lambda and SQS, with a management console for the routing, the transforms and the alerting behind it. It scales with the input rather than ahead of it, treats a backlog as back-pressure rather than an outage, and alerts on the failure mode most pipelines miss entirely: silence.
A pipeline is only as good as what it tells you.
The transformation itself — reshape the message, enrich it, route it on — is the easy half. The half that decides whether anyone can rely on the pipeline is operational: whether a backlog is visible before it becomes a data gap, whether a poisoned message ends up somewhere recoverable, and whether anyone finds out when the upstream stops sending. This project built both halves, and the console is the deliverable as much as the functions are.
Five things that follow from running it serverless.
Transform on the fly, at whatever rate arrives
Serverless is the right shape for a transform pipeline whose input rate is not yours to control. Work fans out across Lambda as fast as the queue fills and costs nothing when it does not — without a cluster sitting idle between peaks or falling over during them.
Queues make back-pressure a design, not an incident
SQS between the stages means a downstream slowdown becomes a growing backlog rather than a cascade of failures. The backlog is measured, alerted on, and drains by itself once the cause clears.
The dangerous failure is silence
A pipeline that throws errors is a pipeline that is telling you something. The one that stops being invoked entirely says nothing at all — so an explicit ingest-silence rule fires when invocations hit zero, which is the alert that catches an upstream that quietly stopped sending.
Read-only by default, on purpose
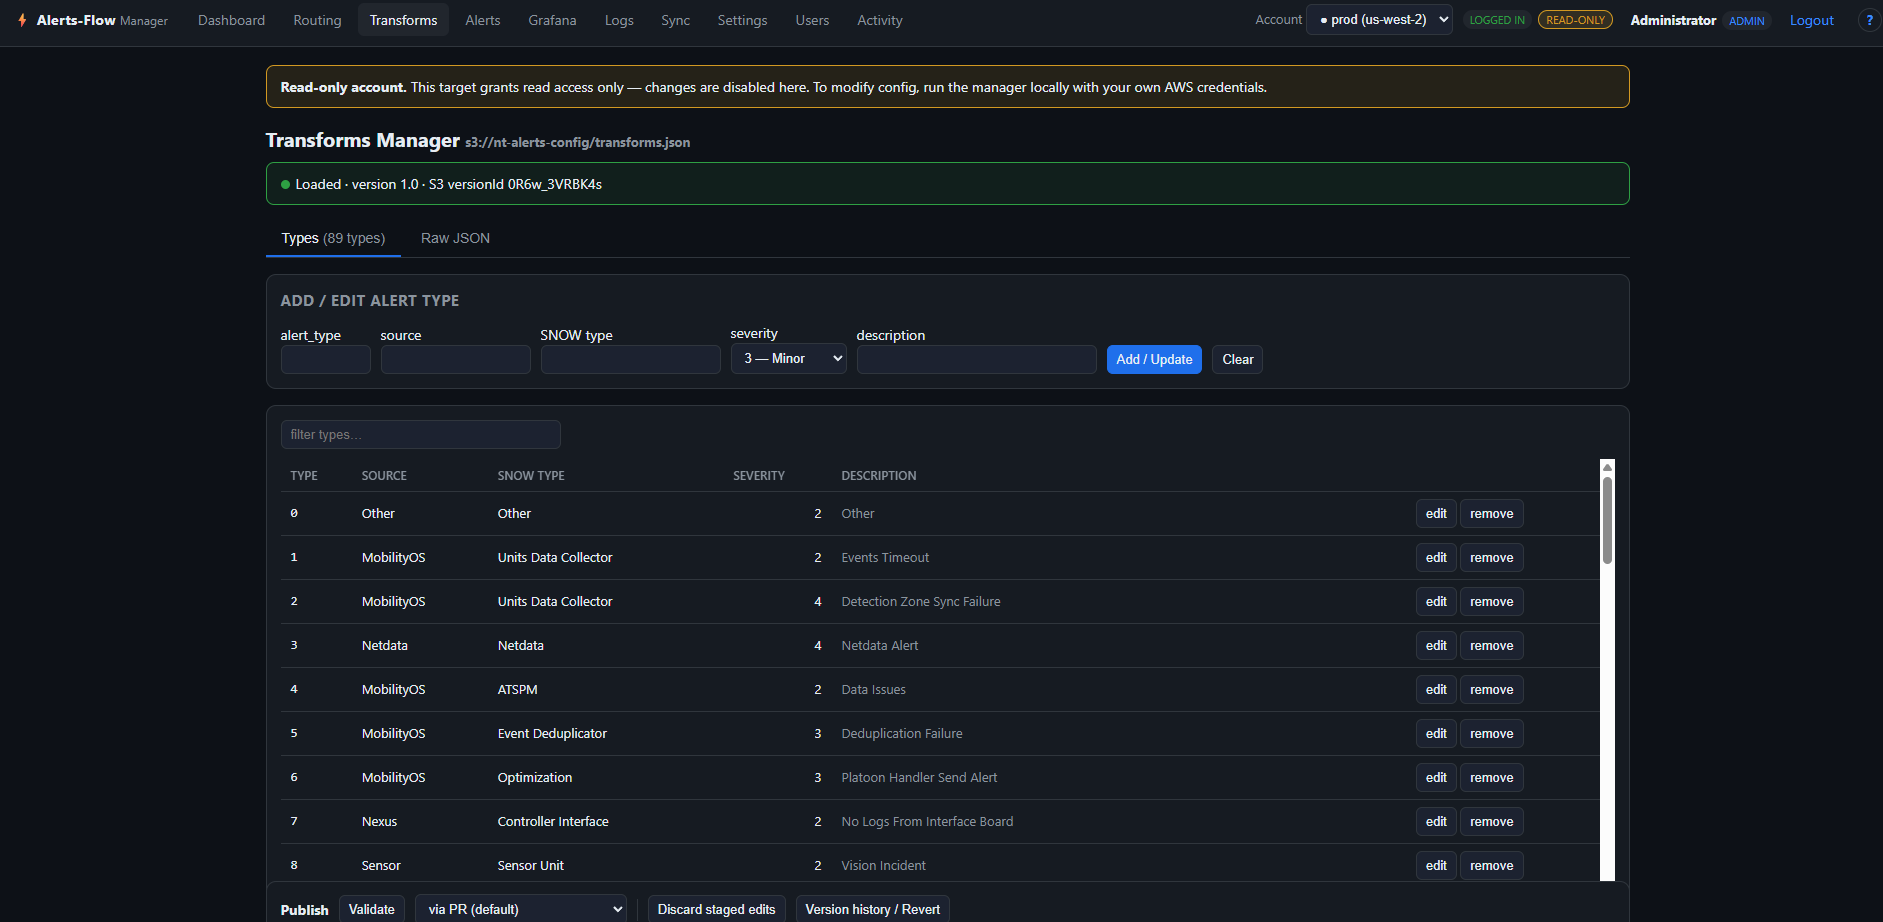
The console targets an account in read-only mode and states so plainly on screen. Changing configuration requires running the manager locally under your own credentials. Making the destructive path deliberately less convenient than the observational one is the point.
One console per account and region
The target is selected explicitly — account and region — so there is never ambiguity about which environment is being looked at, which is the failure that produces the worst possible change.
Configuration, not a redeploy.
The shape of the pipeline is editable.
Routing defines the path from source through queues to the functions that handle each message; transforms define what happens to the payload on the way. Both are managed as configuration in the console rather than living only inside function code, so changing where something goes or how it is reshaped does not require a deployment cycle to answer a question.
- Source → queue → function routing, explicit and inspectable
- On-the-fly payload transformation managed as configuration
- Onward synchronisation to destination systems
- Dead-letter queues for messages that cannot be processed
- Concurrency scaling with arrival rate, not provisioned capacity
Falling behind is a state, not a failure.
Putting queues between the stages means that when a downstream system slows, the pipeline accumulates a backlog instead of cascading failures upstream. The backlog is a measured quantity with an alert threshold on it, and it drains on its own once the cause clears. Messages that genuinely cannot be processed go to a dead-letter queue — where the alerting treats any non-zero depth as critical, because there is no healthy amount of undeliverable data.
Five rules that cover how this actually breaks.
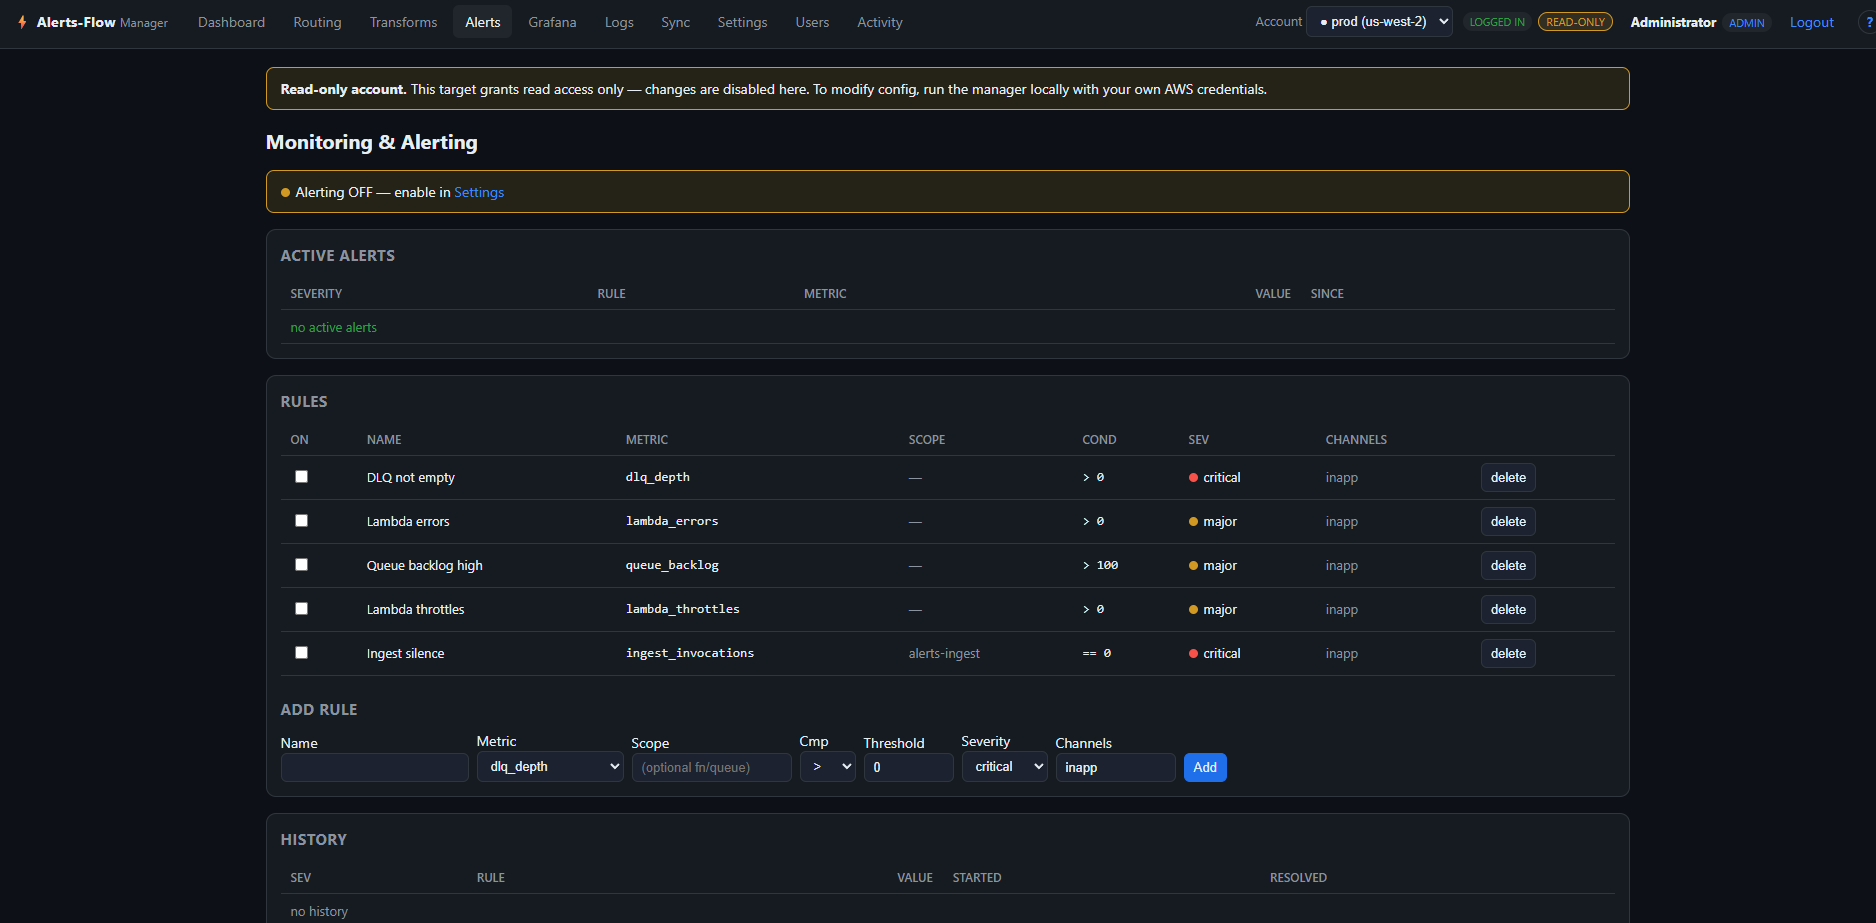
Rules are threshold expressions over pipeline metrics, optionally scoped to a single function or queue, with a severity and a delivery channel. The defaults are not generic — they are the specific failure modes of a queue-and-function pipeline.
| Rule | Condition | Severity | What it catches |
|---|---|---|---|
| Dead-letter queue not empty | dlq_depth > 0 | Critical | Anything landing in the DLQ means a message could not be processed at all — there is no acceptable non-zero value. |
| Lambda errors | lambda_errors > 0 | Major | Function-level failures, surfaced immediately rather than discovered in a weekly review. |
| Queue backlog high | queue_backlog > 100 | Major | The pipeline is falling behind its input rate — still working, but no longer keeping up. |
| Lambda throttles | lambda_throttles > 0 | Major | Concurrency limits are biting, which caps throughput before anything visibly breaks. |
| Ingest silence | ingest_invocations == 0 | Critical | Nothing is arriving. The failure that produces no errors, because no code ran. |
Active alerts carry severity, rule, metric, current value and how long the condition has held; firing history records when each alert started and resolved, so a rule that flaps is visible as a pattern rather than as a series of unrelated pages.
The console makes the safe thing easy.
A target account is selected explicitly, with its region, and by default it grants read access only — the console says so in a banner rather than discovering it at write time. Modifying configuration requires running the manager locally under your own credentials. That asymmetry is deliberate: looking at production should be effortless, and changing it should require a decision.
Every area of the manager.
Pipeline
- Routing — Where messages go — the mapping from source through queues to the functions that handle them.
- Transforms — The on-the-fly transformations applied as data passes through, managed as configuration rather than buried in code.
- Sync — Synchronisation of the resulting data onward to its destinations.
Observability
- Dashboard — The current state of the pipeline across its functions and queues.
- Logs — Execution logs, reachable from the console rather than from a separate hunt through the cloud provider.
- Grafana — Integration with the metrics stack, so the pipeline’s telemetry sits alongside everything else.
- Activity — An audit trail of what was changed, by whom and when.
Alerting
- Active alerts — What is firing now, with severity, rule, metric, value and how long it has been in that state.
- Rules — Threshold rules over pipeline metrics, with optional scoping to a specific function or queue.
- Rule builder — Name, metric, scope, comparator, threshold, severity and channel — added from the console.
- History — Alerts that fired and when they resolved, so recurrence is visible.
Control
- Account & region target — Explicit selection of the account and region the console is pointed at.
- Settings — Configuration for alerting and pipeline behaviour.
- Users — Access to the manager itself.
Platform & architecture.
| Compute | AWS Lambda, scaling with the arrival rate rather than provisioned ahead of it |
|---|---|
| Queuing | Amazon SQS between stages, including dead-letter queues for unprocessable messages |
| Transformation | On-the-fly transforms applied in flight, managed as configuration |
| Routing | Explicit source-to-queue-to-function routing, editable in the manager |
| Metrics | Pipeline metrics including DLQ depth, function errors, throttles, queue backlog and invocation counts |
| Alerting | Threshold rules with optional per-function or per-queue scope, severity and channel routing |
| Dashboards | Grafana integration alongside the built-in console |
| Safety | Read-only console targets by default; configuration changes require locally supplied credentials |
| Audit | An activity trail across configuration changes |