
A pipeline that is never switched off.
Continuous collection and synchronisation of very large data volumes across regions and customers — landing raw payloads to object storage, de-duplicating in twelve layers, syncing into several database engines at once, and repairing itself before anyone is paged. Built for always-on operation, and instrumented so that its own health is as visible as the data it moves.
At this volume, the hard problem is not moving the data.
Moving large volumes is a solved problem. What is not solved, and what consumes the engineering, is everything around it: duplicates arriving from four different directions, a backfill running against live traffic, a replica drifting, a customer whose data stopped arriving three hours ago without producing a single error. This pipeline is built around those failures rather than around the happy path.
Five things that follow from never stopping.
Built for always-on, not for a batch window
This is a pipeline that runs continuously for years across regions and customers. Everything in it — staging, de-duplication, rebalancing, health checking — is designed around the assumption that it will never be stopped and restarted cleanly, because in practice it never is.
Twelve levels of de-duplication
At this volume, duplicates arrive from every direction: retried deliveries, overlapping windows, replayed backfills, upstream re-sends. A layered de-duplication engine resolves them in twelve stages rather than trusting one key, because a single unique constraint is exactly what fails first at scale.
Several database engines, on purpose
A columnar store for the analytical volume and a relational store for the operational and reference data — each doing what it is good at, with the pipeline responsible for keeping them consistent rather than pretending one engine can do both jobs.
It repairs itself before anyone is paged
Self-healing is a design property, not a runbook. Failed stages retry, gaps are detected and refilled, and rebalancing runs against the cluster — so the common failures resolve without a human, and the alerts that do fire are the ones worth waking up for.
Continuously health-checked, per customer
Dozens of active checks run against every customer’s pipeline, rolled up into pass, warn and fail, with missing-item detection to catch the failure that produces no error at all: data that simply never arrived.
Raw, staged, de-duplicated, synced.
One unique key is what fails first.
Raw payloads land to object storage before anything touches them, so the original is always recoverable and a bad processing release is a re-run rather than a data loss. Staging validates and de-duplicates before the target is written. De-duplication is layered across twelve stages because duplicates at this scale are not one phenomenon — retried deliveries, overlapping collection windows, replayed backfills and upstream re-sends each need catching differently.
- Raw landing to object storage ahead of processing
- Staging schema for validation and de-duplication
- Twelve-level de-duplication engine
- Synchronisation into multiple database engines, kept consistent
- Backfill and replay running alongside live ingestion
Two stores, each doing what it is good at.
A replicated columnar cluster carries the analytical volume — a master with multiple replicas, each sized and monitored independently. A relational cluster carries the operational and reference data, with distinct target and staging schemas. Keeping both consistent is the pipeline’s job, which is a deliberate choice: the alternative is pretending one engine is good at both, and then discovering which half it is bad at once the data is too large to move.
The console exists because the pipeline is the product.
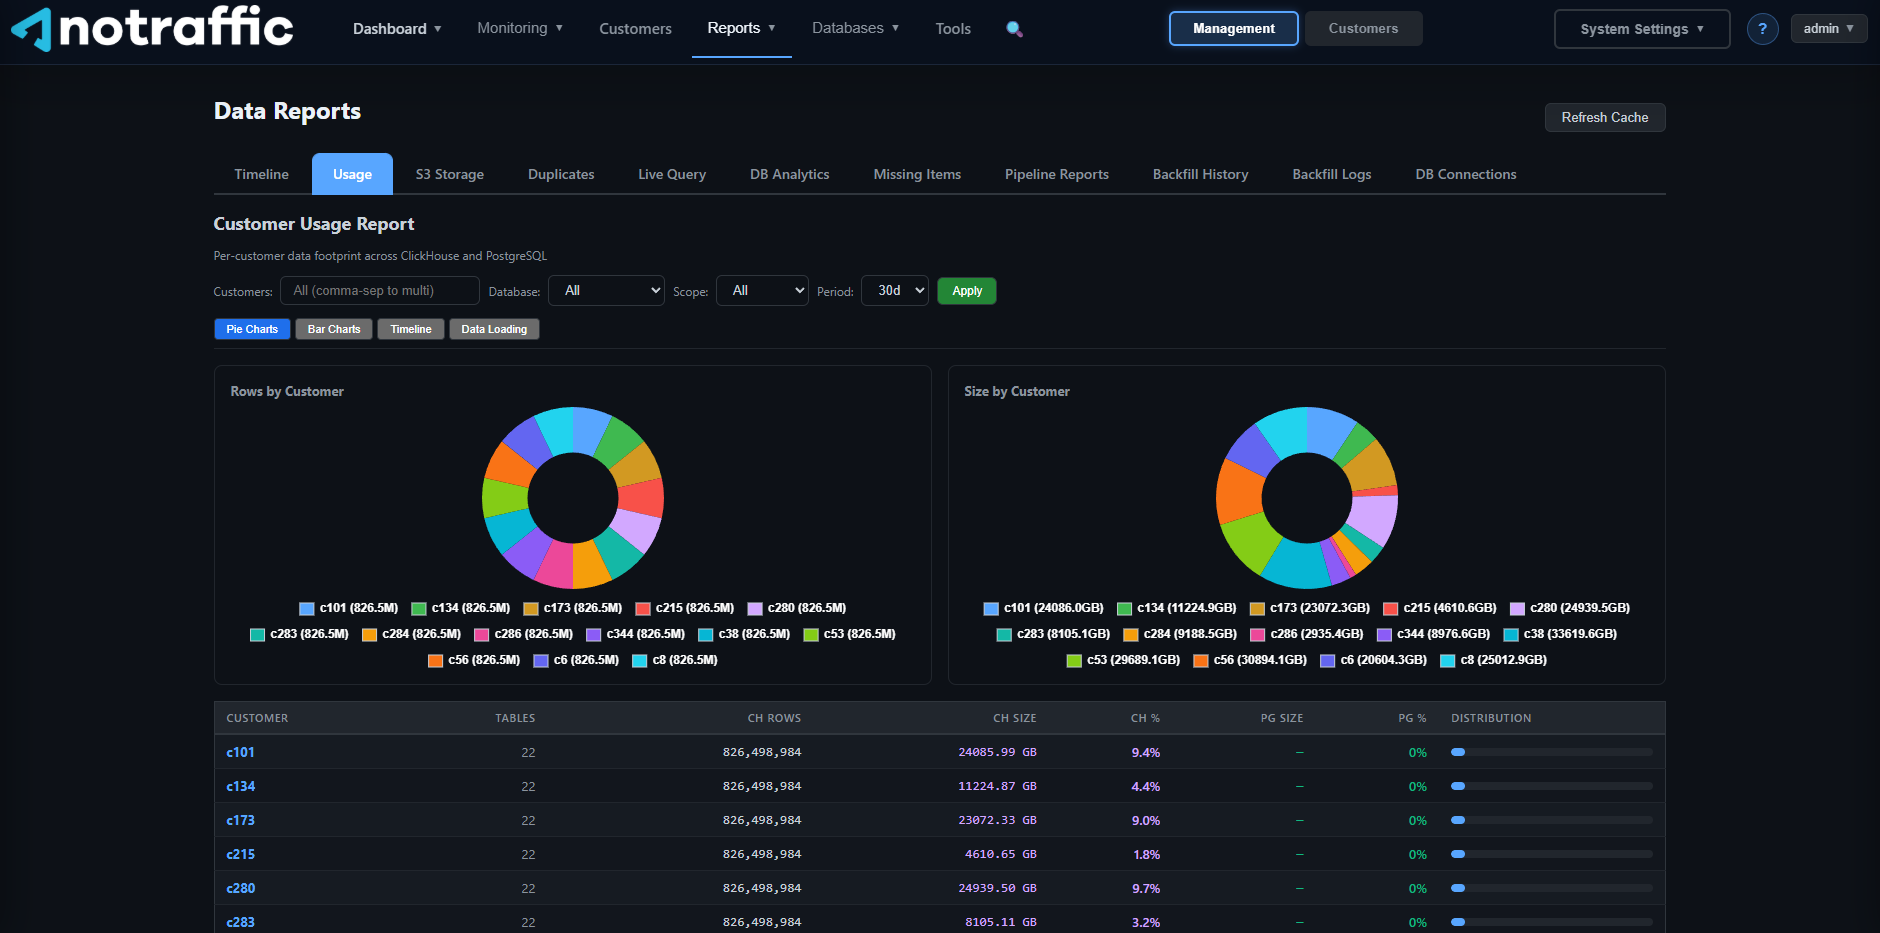
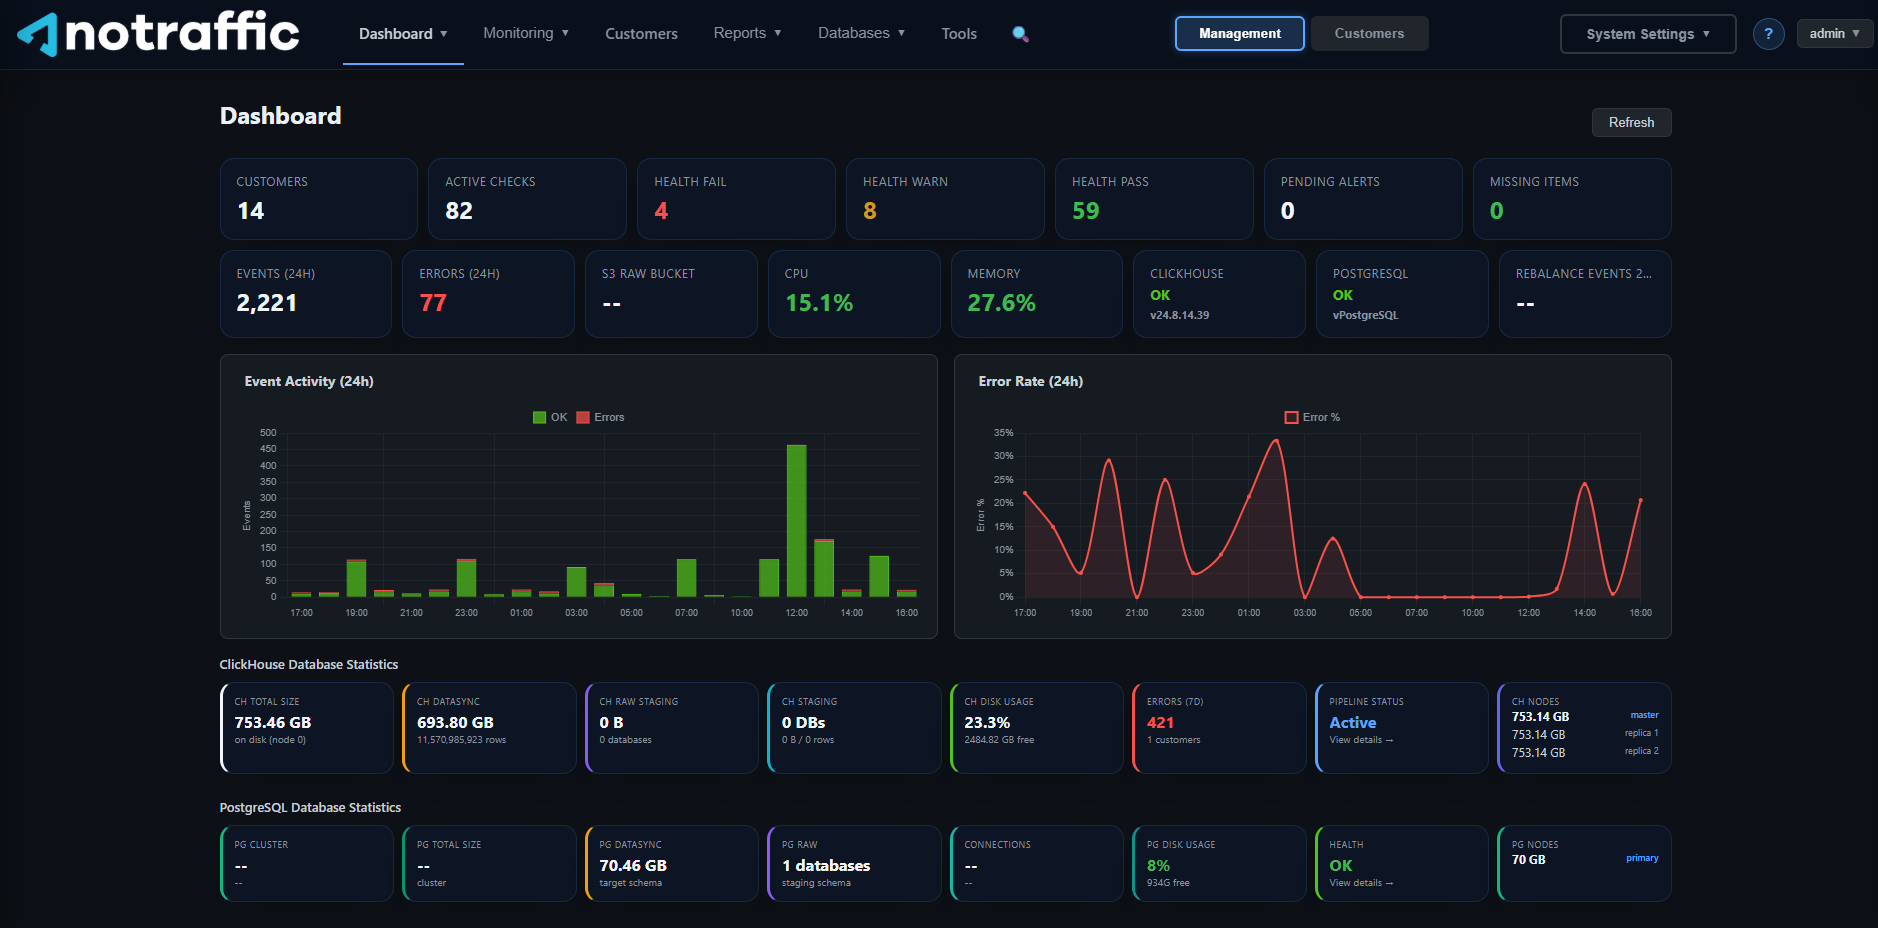
An always-on pipeline needs its own operational surface. Active checks run continuously against every customer and roll up into pass, warn and fail. Event volume and error rate are charted over rolling windows so that a change in shape is visible before it becomes an incident. Each engine reports its size, schema breakdown, disk headroom, node and replica state, and pipeline status.
Active checks
Dozens of assertions per customer, rolled up to pass, warn and fail.
Missing items
The failure that produces no error — data that simply never arrived — detected explicitly.
Event & error rate
Volume and error percentage over rolling windows, tracked separately.
Rebalance events
Cluster rebalancing tracked as first-class events rather than performed by hand.
The whole estate, or one customer.
The console switches between a management view across the estate and a single-customer view, because the two questions — “is the platform healthy” and “is this customer’s data arriving” — are different and get asked by different people. Alerts carry the customer and the check that raised them, so the second question is answerable without first answering the first.
Every area.
Ingestion
- Collection — Continuous collection from distributed sources across regions.
- Raw landing — Raw payloads landed to object storage before any processing, so the original is always recoverable.
- Staging schema — A staging layer where data is validated and de-duplicated before it is allowed near the target.
- Backfill & replay — Historical loads and re-processing that run alongside live ingestion rather than instead of it.
Processing
- De-duplication — A twelve-level engine resolving duplicates from retries, overlapping windows, replays and upstream re-sends.
- Sync to targets — Writing into multiple database engines and keeping them consistent with one another.
- Rebalancing — Cluster rebalance operations tracked as first-class events rather than run by hand.
- Integrity checks — Missing-item detection, so data that never arrived is a finding rather than a silence.
Operations
- Dashboard — Customer count, active checks, health pass / warn / fail, pending alerts and missing items in one band.
- Event activity — Event and error volume over rolling windows, so a change in shape is visible before it becomes an incident.
- Error rate — Error percentage over time, tracked separately from raw counts.
- Monitoring — The active check catalogue and what each one is asserting.
- Per-engine statistics — Size, row counts, schema-level breakdown, disk headroom, node and replica state, and pipeline status per engine.
- Alerts — Pending alerts surfaced against the customer and the check that raised them.
Management
- Customers — Per-customer pipeline view, with the console scoped to one customer or to the whole estate.
- Databases — The database inventory behind the pipeline, per engine and per node.
- Reports — Operational reporting over the pipeline itself.
- Tools — The operator toolbox for the interventions that cannot be automated away.
- System settings — Configuration for checks, thresholds and pipeline behaviour.
Platform & architecture.
| Language | Python |
|---|---|
| Analytical store | A replicated columnar cluster — a master with multiple replicas, sized and monitored per node |
| Operational store | A relational cluster with a primary, carrying target and staging schemas |
| Object storage | Raw payload landing prior to processing, so the original is always recoverable |
| De-duplication | A twelve-level engine, layered rather than dependent on a single key |
| Resilience | Self-healing retries, gap detection and refill, and tracked cluster rebalancing |
| Monitoring | Continuous active health checks per customer, rolled up to pass / warn / fail, with missing-item detection |
| Console | A management console with per-customer scoping, live event and error-rate charts and per-engine statistics |
| Operation | Designed for long-running, always-on, 24/7 operation across regions |