
A screen that shows its confidence, and its working.
A market scanner that screens equities and scores them with a Wyckoff-based confidence model — producing ranked long and short candidates with entry and target levels, the distribution of confidence across the field, and the history of how the screen has behaved over successive runs.
A tool for narrowing a field, not for telling you what to do.
A screen’s job is to reduce several thousand instruments to a short list worth a person’s attention, and to be honest about how confident it is in each one. This one runs a defined method, scores every candidate on a stated scale, ranks long and short together, and shows you the shape of the whole distribution rather than only the top of it.
What this is, and what it is not.
This product is a research and screening tool. It is not investment advice, and nothing it produces is a recommendation to buy or sell any instrument. A score is a confidence value under a named model — not a prediction, not a probability of profit, and not a statement about future performance. Entry and target levels are model outputs to evaluate against your own rules and risk limits, not instructions.
No performance figures, win rates, backtests or accuracy claims are published for this product, because none would be meaningful without the assumptions behind them. Markets carry risk of loss, including total loss. Decisions made using this tool are the user’s own.
Five things that follow from stating the method.
One model, stated plainly
Candidates are scored by a Wyckoff-based confidence model, and the score is presented as what it is — a confidence value between 0 and 100% under a named method — rather than as a signal dressed up as certainty.
Long and short, side by side
The screen produces a ranked long list and a ranked short list from the same run. Seeing both together is the point: a screen that only ever surfaces reasons to buy is telling you about itself, not about the market.
Levels, not just names
Each candidate carries an entry and a target level alongside its score, so the output is something you can actually evaluate against your own rules rather than a list of tickers to go and research from scratch.
The distribution is visible
The score distribution across the current candidate set is shown, so you can see whether the run produced a handful of strong candidates or a flat field. A ranked table alone hides that; the histogram does not.
Every scan is kept
Scan history tracks screened, scored and trade-ready counts over successive runs, so the behaviour of the screen itself is observable over time.
Screen, score, rank — and say how many cleared the bar.
A number on a stated scale.
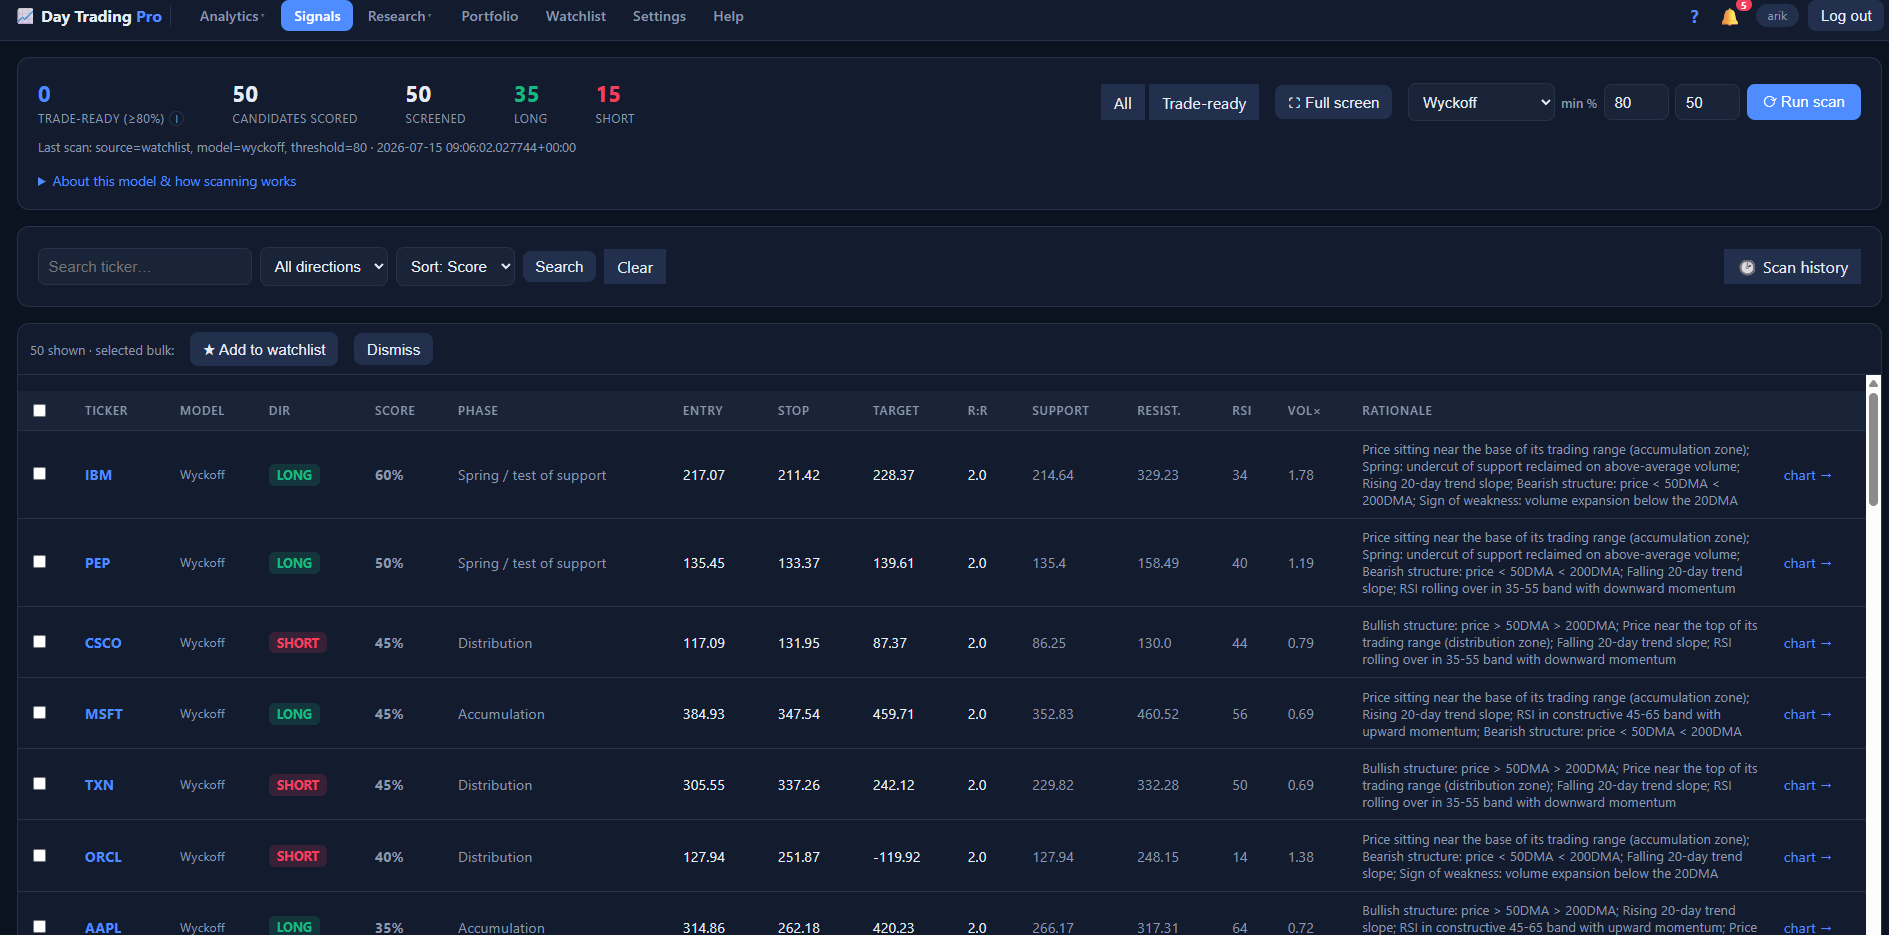
Every scan reports how many instruments were screened, how many were scored, how they split between long and short, and how many cleared the trade-ready threshold — which is frequently zero, and the interface says so rather than promoting the best of a weak field. Each candidate carries its confidence score with an entry and a target level.
- Screened, scored, long, short and trade-ready counts on every run
- Wyckoff confidence from 0 to 100% per candidate
- Ranked long and short tables from the same scan
- Entry and target levels alongside the score
- The data mode the scan ran in, shown on screen
The screen’s own behaviour is data too.
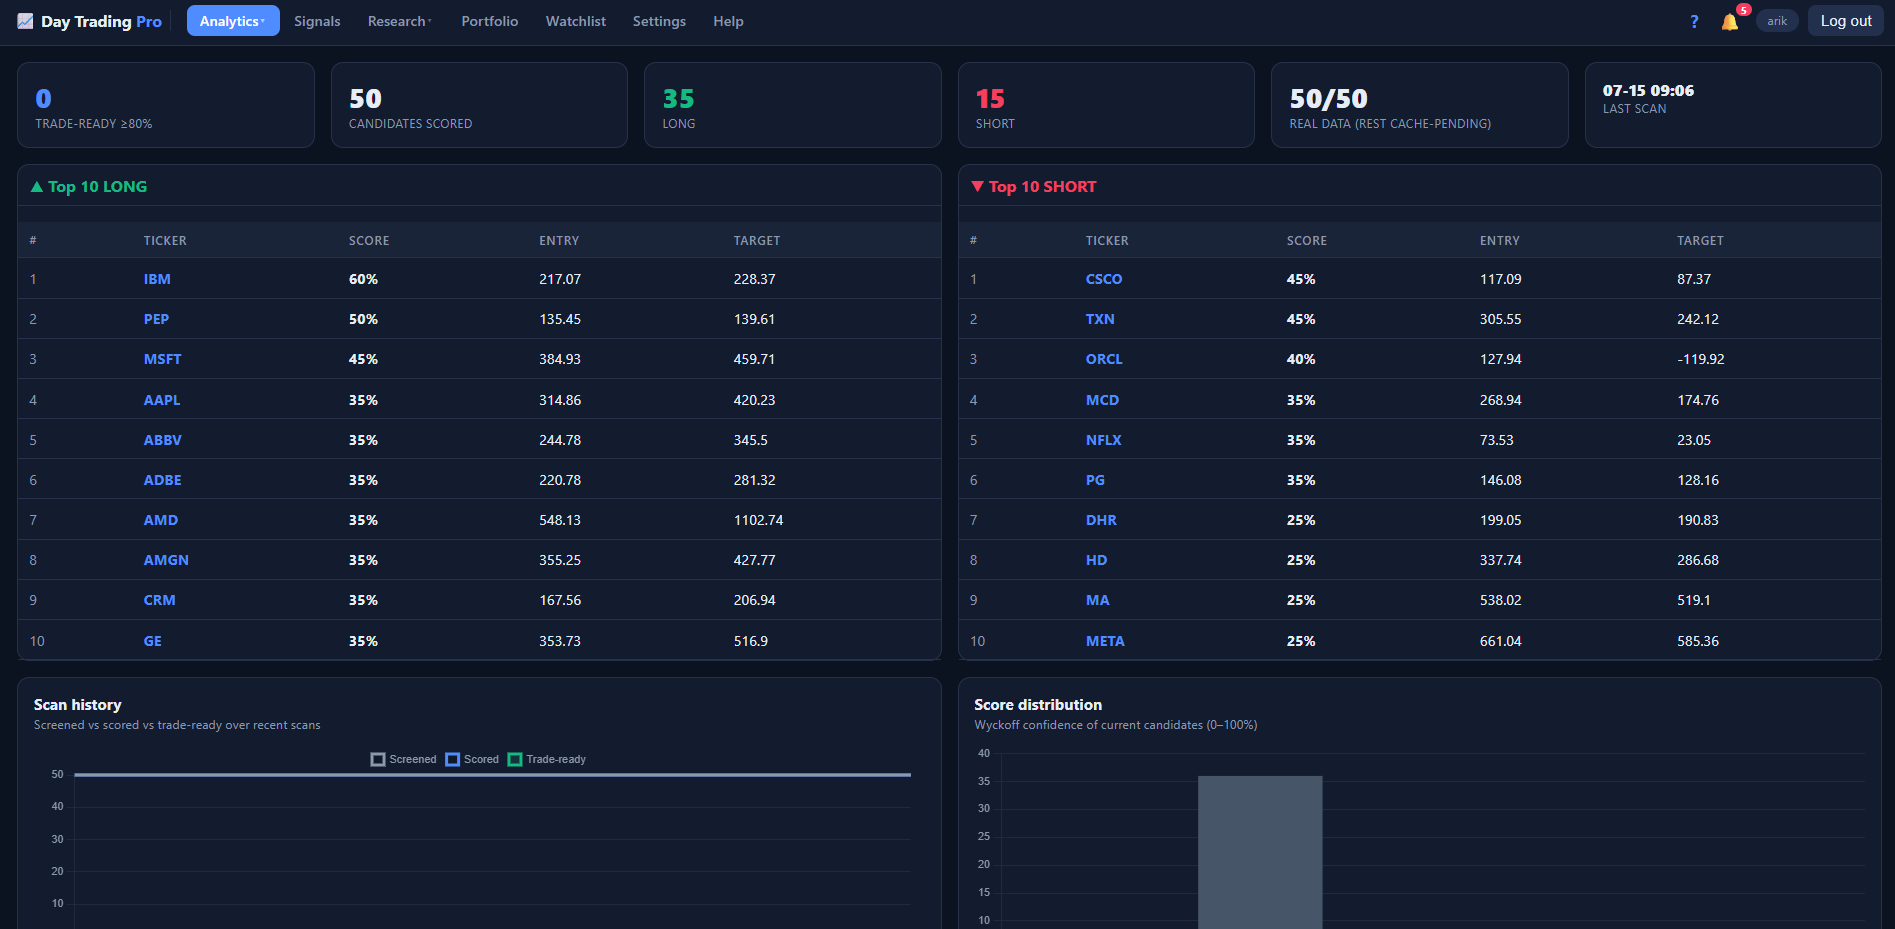
Two panels sit under the tables for a reason. Scan history plots screened, scored and trade-ready counts across recent runs, so a screen that has stopped producing anything is visible immediately. Score distribution shows the confidence spread across the current candidate set, so a top-ranked candidate at 60% in a field where nothing exceeds 60% reads very differently from the same 60% in a field with several above it.
Signals, research, watchlist and book.
The scan produces a short list; the rest of the application is about what you do with it. Signals cover thresholds you asked to be notified about. Research is the per-instrument surface behind a candidate. The watchlist follows instruments across scans whether or not they score, and the portfolio keeps what you actually hold separate from what the screen currently finds interesting — a separation worth enforcing in software rather than in discipline.
Analytics
- Scan summary — Candidates screened, candidates scored, long and short counts, how many cleared the trade-ready threshold, the data mode in use and the time of the last scan.
- Top long — The ranked long candidates with score, entry and target for each.
- Top short — The ranked short candidates, produced by the same run and shown alongside.
- Scan history — Screened, scored and trade-ready counts across recent scans.
- Score distribution — The spread of Wyckoff confidence across the current candidate set, from 0 to 100%.
Signals & research
- Signals — Where a candidate crossed a threshold that you asked to be told about.
- Research — The per-instrument research surface behind a candidate on the list.
Your book
- Portfolio — What you hold, kept separate from what the screen is currently suggesting is interesting.
- Watchlist — Instruments you want followed across scans whether or not they score.
Setup
- Settings — Scan configuration, thresholds and the market-data mode.
- Help — In-application guidance for the screens and the score.
Platform & architecture.
| Application | A web application with a scan API behind it |
|---|---|
| Model | A Wyckoff-based confidence model producing a 0–100% score per candidate |
| Output | Ranked long and short candidate lists with entry and target levels |
| Analytics | Scan history and score distribution over successive runs |
| Market data | Pluggable market-data provider; the interface states which data mode a scan ran in |
| Surfaces | Analytics, signals, research, portfolio, watchlist, settings and help |
| Deployment | Containerised, served over the platform edge with TLS |
In development — not yet shipped.
Listed here explicitly rather than blended into the feature copy, so it is clear what the product does today and what it is going to do.
| Multi-model framework | Scoring beyond the single Wyckoff model, with models selectable and comparable. |
|---|---|
| Additional models | Momentum, mean-reversion, breakout and moving-average-cross. |
| Model tutorial | An education surface explaining what each model does and what its score means. |
| Bilingual help centre | English and Hebrew, with full right-to-left support. |
| Company page | Earnings dates and history, analyst ratings and price targets, a news feed, and peer and sector comparison. |
Everything in this table is planned work. Nothing in it is available today, and none of it should be read as a commitment to a date.