Twelve alarms, one fault
Classic monitoring opens an incident per failing check. A host with twelve failing services produces twelve headlines, and the person on call has to work out that they are one problem.
Observe · Observatory
Observatory is Tracston's observability platform. It watches your infrastructure, networks, applications and AI agents in one place, turns a flood of alerts into a handful of incidents, and traces each one from the symptom to its root cause, with the evidence attached.
It runs inside your own infrastructure, on its own or next to the rest of the Tracston platform.
Connect monitoring, investigation, and controlled recovery in one operational platform.
The problem
A single customer request now crosses AI agents, models, APIs, microservices, Kubernetes, databases, cloud services and the network underneath all of it. Every layer has its own monitoring tool, and each one raises its own alarms.
More signals don't create more clarity.
Classic monitoring opens an incident per failing check. A host with twelve failing services produces twelve headlines, and the person on call has to work out that they are one problem.
When a whole site goes dark, ten hosts each report their own outage. Ten quiet alerts are not one loud one, and the sentence the operator needs ("the site is off") is never written.
An AI agent can return a clean HTTP 200 while the task it was given fails. Application monitoring sees the request, not the prompt, model, tool calls and policy decisions behind it.
How it works
Observatory collects from everything you run, builds a map of how it depends on itself, and uses that map to decide which alarms belong together and where they started.
Collectors run scheduled checks, and reach hosts that will never run an agent over SSH and SNMP instead. Listeners accept syslog, SNMP traps, webhooks and network flows, buffering to disk so an outage of the control plane loses nothing. An optional host agent sends inventory and vitals, and any OpenTelemetry SDK can send traces straight in.
Scheduled discovery keeps every run as a version, so you see what is new, what changed and what is gone. Nothing becomes monitored just by being found: findings wait for a person to promote them. The estate is modelled as a hierarchy (site, hypervisor, VM, container, cluster) and as a dependency graph that records which way a failure travels.
Every check moves through soft and hard states before it opens an incident. Seasonal baselines, kept per hour of the week, tell a nightly batch job apart from a real spike at two in the afternoon.
Independent correlators each propose links between incidents: connected in the dependency graph, the same host, followed the same deployment, the same product, the same subnet, or started at the same moment. Links add up, and no single weak signal can group two incidents on its own. Every grouping shows which correlator did the work.
The dependency graph is walked both ways: forward for the blast radius (what else breaks) and backward for the root-cause candidates. The investigation gathers the state changes, metrics, logs and related incidents behind it, so the conclusion arrives with its evidence.
Alerts route to the owning team through email, chat, SMS, voice or webhooks, with storm protection that folds bursts into a digest. Remediation runs only through approved playbooks, and the same checks that raised the alarm show the recovery.
The storm, then the incident
One component fails and the failure travels: database, API, payments, checkout, AI assistant, customer. Every layer raises its own alarm. Observatory folds the storm into one incident and follows it down to where it started.
Illustrative scenario, not customer data.
Observatory starts where the customer feels it and follows the dependency graph down, layer by layer, until it reaches the component that broke first.
Ask the lighthouseWhy is checkout slow?
Checkout latency increased at 14:32. Primary cause: PostgreSQL connection pool exhaustion. Contributing factor: the AI reconciliation agent's concurrency rose from 4 to 32. Affected: Checkout, Payments, Customer Portal, AI Assistant.
AI with operational evidence, not "AI knows everything". Every statement is labelled by what kind of claim it is.
Self-Healing & Autonomous Recovery
Observatory connects operational signals, service dependencies, and approved recovery workflows to help teams restore service with clear control over every action. Follow the investigation, understand the proposed response, and verify that the service is working again.
01
Connect infrastructure symptoms to the applications and business services that depend on them.
02
Apply recovery policies, approved workflows, and human approval where required.
03
Check service health and user-facing functionality after recovery actions.
04
Turn reviewed recovery experience into reusable workflows for recurring incidents.
Capabilities
AI doesn't run in isolation. Observatory sees every layer underneath it, from the people and business services at the surface to the network and physical infrastructure on the ocean floor.
Humans · business services · AI agents
Applications · APIs · AI services
Containers · Kubernetes · databases
VMs · hosts · storage
Network · physical infrastructure
Scheduled network scans keep every run, so the question "what is new, changed or gone since last time" has a direct answer. Found assets stay pending until someone promotes them.
Site, hypervisor, VM, container and cluster, built from your CMDB, from what the container runtime reports, and from inference, with each source kept distinct.
The network map is derived from the addresses your checks actually probe, and a host takes the worst state among its services. Sites appear on a geographic map only when they have real coordinates.
LLDP, CDP, ARP, forwarding and route tables over SNMP build physical, access and routed layers, with run-to-run changes recorded as events.
Host inventory is snapshotted and diffed. Installed packages are matched against OSV advisories, with CISA's known-exploited list on top.
Nodes, namespaces, workloads and the pods that are not healthy, read through a credential you supply once and keep sealed.
Built-in check plugins for ping, TCP, HTTP, DNS, certificates, SSH, SNMP, Docker, disk, PostgreSQL, MySQL, Redis, MongoDB, Prometheus and node exporters, and Nagios-style scripts, plus a metrics explorer and seasonal baselines.
Search logs with a Loki-style query language. Logs stay in PostgreSQL by default, or move to a ClickHouse tier for estate-wide volume by configuration, not by code change.
An OpenTelemetry (OTLP/HTTP) receiver accepts spans from standard SDKs. Observatory builds the service map, request rate, errors, duration and Apdex per service.
One trace document from request spans down through protocol, connection, process and kernel activity on the host, where the deep-tracing layer is deployed.
NetFlow v5 and v9, IPFIX and sFlow feed a traffic explorer: top talkers, conversations and per-interface views, enriched with device and site.
HTTP synthetic tests run from built-in monitoring locations, so you learn about a broken journey before a customer does.
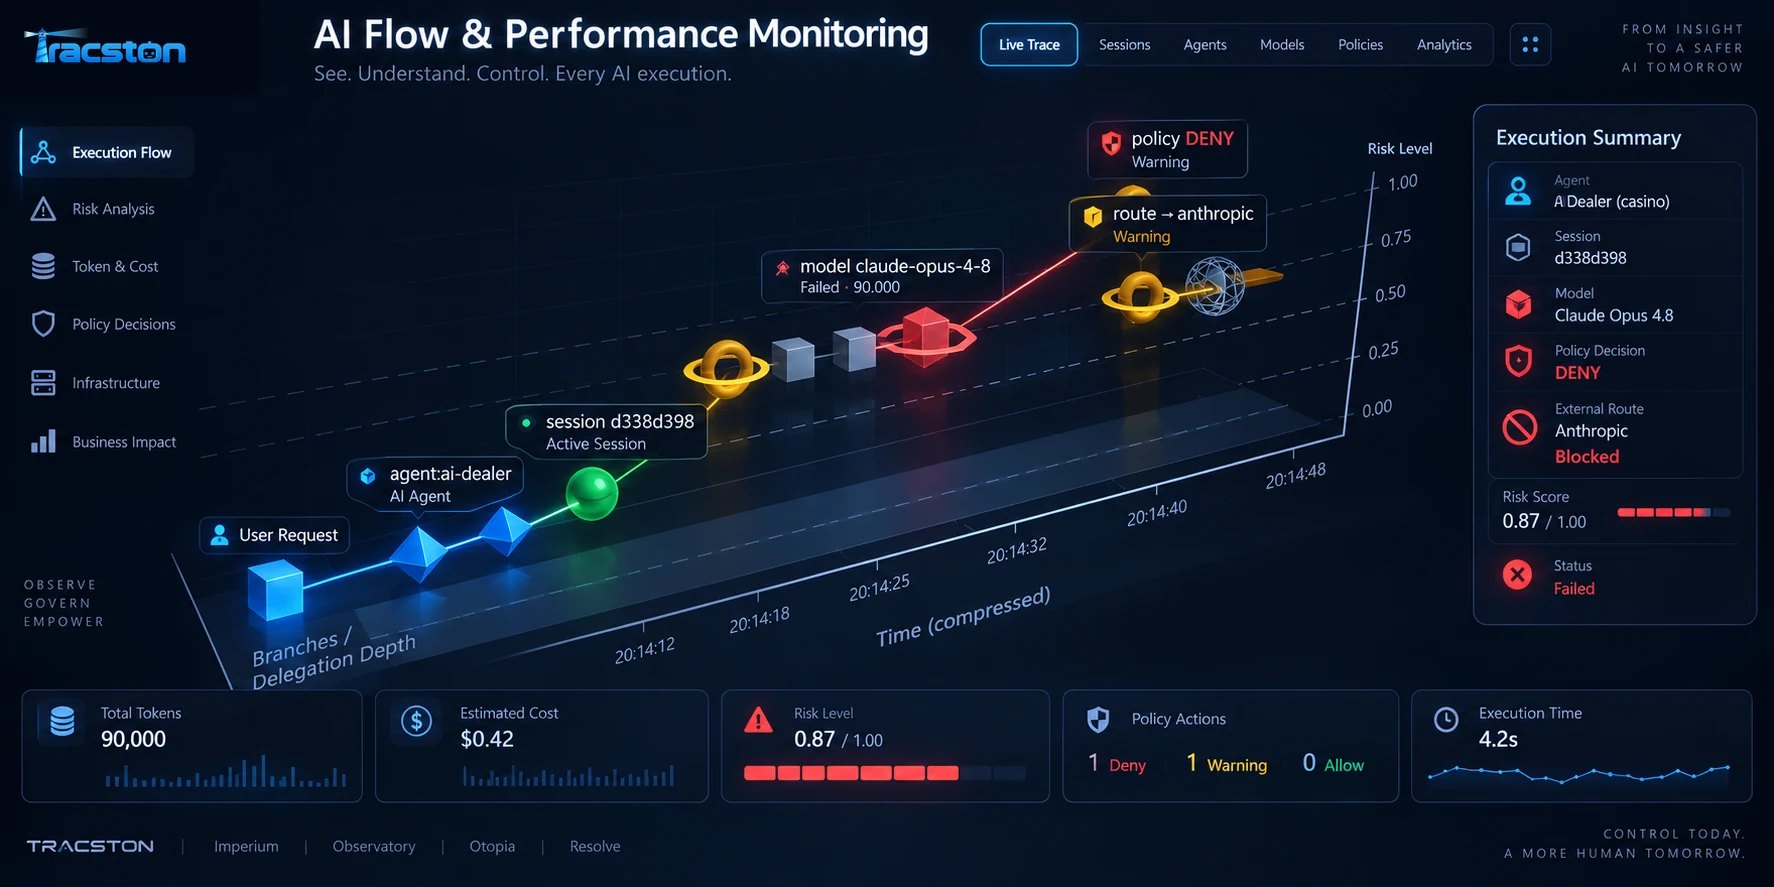
AI Flow & Performance Monitoring follows AI execution from the first prompt through models, agents, tools, MCP servers, retrieval systems, applications and infrastructure.
Illustrative tracetotal 2.33 s
The lighthouse finds the bottleneck: model routing, 842 ms.
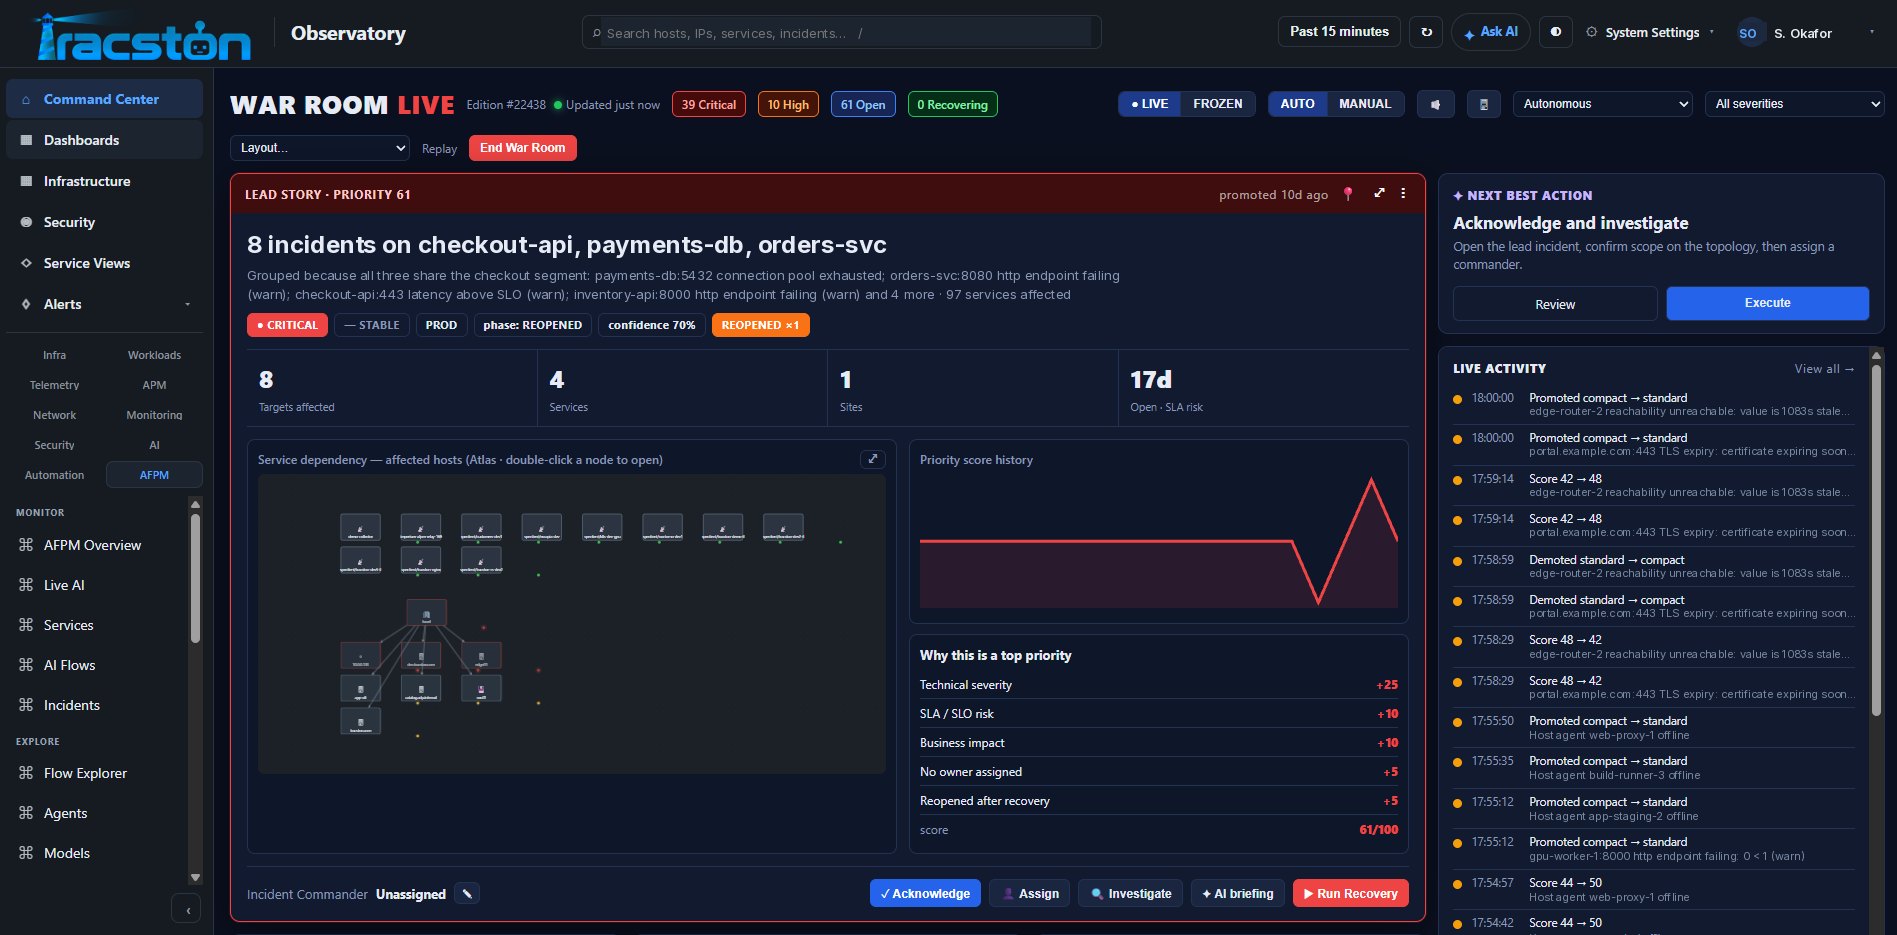
Alerts become incidents, and incidents that share a cause become one persistent story, such as "collector lost, 25 targets unobserved" rather than 25 cards. A whole site going dark is said once.
During an incident the response is recorded as structured events (roles, tasks, decisions, updates), so the post-incident review is generated rather than rewritten from memory.
Email, Slack, Microsoft Teams, Telegram, SMS, voice, push, webhooks and n8n, with on-call directories and escalation. Maintenance windows and suppressions are logged with their reason.
Rate limits per channel and per recipient. When a limit is hit, messages are gathered into one digest rather than dropped, and a global kill switch stands behind it.
Roll technical services up to the business services and customers that depend on them. Status page components can follow live incidents automatically, and a separate customer portal shows status without exposing infrastructure details.
Recovery checks the same dependency map before it acts: Self-Healing →A detection engine runs rules over host events, inventory changes and vulnerability matches, de-duplicating repeats into one finding with a count. Sigma rules can be imported; anything that cannot be expressed is imported disabled, with the reason.
Ask in plain language: what changed, why did this host alert, is anything suppressed right now. The question is routed in code to a fixed set of read-only tools over live data, and every answer carries the rows it came from.
A language model only rephrases what the tools found. With the model off, expired or unreachable you still get the facts, and during an incident many operators prefer them. You can use local models or a hosted provider.
Each playbook runs in one of four modes: observe, recommend, require approval, or automatic. Automatic mode is refused for anything destructive, and the person who approves cannot be the person who asked.
One lighthouse
People get incidents, root causes, evidence and recommended actions they can read. AI agents get the same operational reality as structured context they can safely use to investigate. Nothing here replaces your judgement: Observatory explains and recommends, and an approval-gated action is the only thing it may execute.
Engineer
AI agent
Someone notices checkout is slow. Observatory finds the root cause. Otopia prepares the fix, Imperium checks it against policy, a person approves, and Observatory confirms the recovery.
Deployment and security
Observatory is deployed inside your infrastructure or a private environment. The monitoring that matters most is the monitoring that still works when the internet does not.
Standalone
A complete product with its own console, users and API. It needs no other Tracston product.
Together
Feeds customer and management views in ResolveSystem, and connects to Imperium for AI flows when both are deployed.
Customer-managed
Installed on-premises or in your private cloud, including sites without internet access.
Capabilities are enabled according to deployment and licensing.
Integrations
Standards first, so you can point what you already have at Observatory instead of re-instrumenting.
Who it is for
One console for hosts, services, network and sites, with alerts already grouped into incidents and a war room for the bad days.
OpenTelemetry traces, a service map, logs and metrics next to the infrastructure they run on, and a dependency graph for blast radius.
SNMP polling and traps, discovered L1–L3 topology, flow analytics and a network event timeline.
AFPM shows what agents and models actually did, how long each step took, and which policy decisions applied.
Detections, imported Sigma rules, vulnerability matches on real inventory, and approval-gated playbooks with separation of duties.
Business services, SLA state, status pages and a customer portal that says what is affected in words the business uses.
An observability platform that monitors infrastructure, networks, applications and AI agents in one place, groups related alerts into incidents, and explains each incident's root cause with the evidence behind it.
No. Collectors check hosts and devices from outside, over protocols such as ping, HTTP, SSH and SNMP, and listeners accept syslog, traps, webhooks and flows. The host agent is optional, for when you want local inventory and vitals from a Linux machine.
Yes. Observatory runs an OTLP/HTTP trace receiver that accepts JSON and protobuf, so a standard SDK can send spans by pointing its OTLP endpoint at Observatory. Ingest keys carry the organisation, product and environment the spans belong to.
Several independent correlators each propose weighted links: a real dependency between the components, the same host, the same deployment, the same product, the same subnet, or the same moment. The weights add up, a single weak signal is never enough on its own, and each group shows which correlator was decisive.
It keeps a dependency graph with direction: if A depends on B, a fault in B travels to A. Walking forward gives the blast radius; walking backward gives the root-cause candidates. The investigation then attaches the state changes, metrics, logs and related incidents that support the conclusion.
No. The assistant uses read-only tools and cannot write to the database. Remediation goes through playbooks with explicit modes; destructive actions can never run automatically, and an approver cannot approve their own request.
No. Observatory runs standalone. When Imperium is also deployed, AFPM can read its governed AI events so AI activity appears alongside the rest of the estate.
AI Flow & Performance Monitoring: observing the complete execution path of AI-driven work across prompts, agents, models, tools, infrastructure and outcomes. Our Insights article explains the idea in depth.
Inside your own infrastructure or a private environment. It starts as a single all-in-one container and can be split into separate components. Map code is bundled rather than fetched from a CDN, and the assistant answers from live data even with no model available.
Autonomy needs visibility.
See Observatory on its own site, or ask us to walk you through it on your estate.