Guide · AFPM — AI Flow & Performance Monitoring
Who is watching the AI? Introducing AFPM
AI Flow & Performance Monitoring: reconstructing every AI execution as a traceable flow — across agents, models, policies, tools and infrastructure — so it can be observed, explained and controlled.
- 1User request
- 2Agent
- 3Session
- 4Model
- 5Route
- 6Policy
- 7Outcome
AI is no longer a request. It is an execution flow.
For 25 years our industry learned how to observe almost everything: servers, microservices, network traffic, application latency, database queries, security events. Then AI agents arrived, and a large part of what happens inside our organisations became surprisingly hard to see.
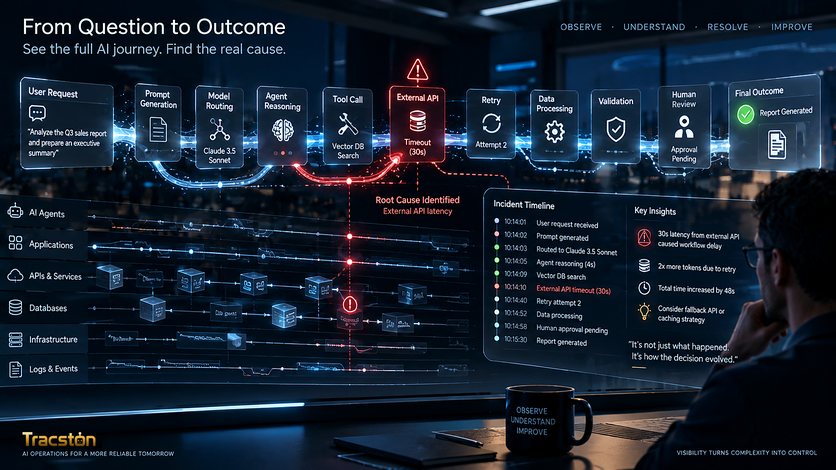
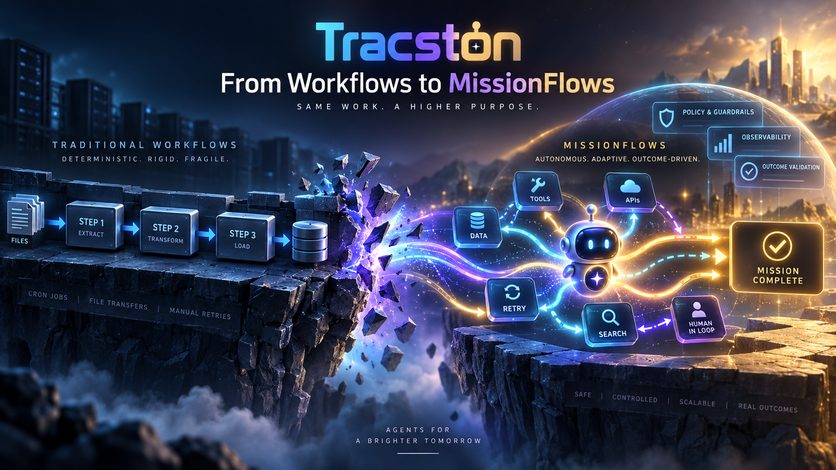
We still picture an AI interaction as User → Model → Answer. In the enterprise a real MissionFlow (previously referred to as an AI workflow) looks more like Human → Agent → Sub-agent → Model → Tool → API → Another agent → Policy engine → External model → Action. Somewhere in that chain, something can go wrong:
- The wrong model is selected
- A prompt contains sensitive information
- An agent attempts an action outside its allowed operating envelope
- A request unexpectedly leaves the organisation
- A model hallucinates
- An agent delegates work to another agent with completely different permissions
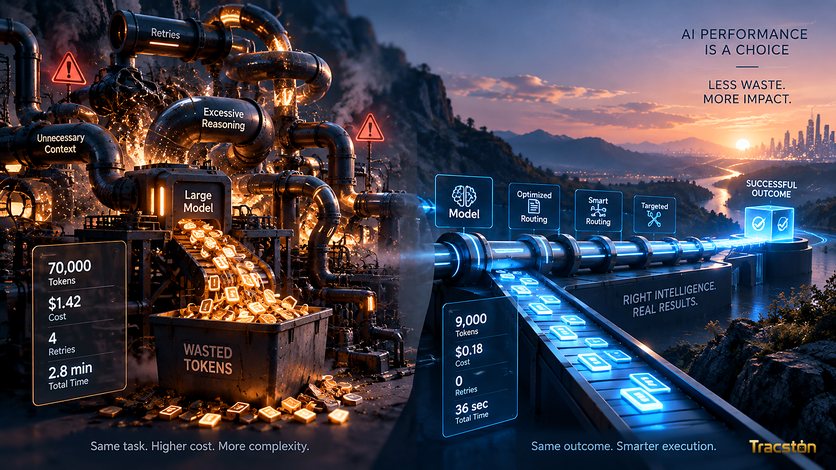
- A MissionFlow becomes unnecessarily expensive
- A policy correctly blocks the operation, but nobody understands why
Logs show fragments. Dashboards show aggregates. Neither shows the path an autonomous decision actually took.
What is AFPM?
AFPM (AI Flow & Performance Monitoring) is the practice of reconstructing every AI execution as a traceable flow — across agents, models, policies, tools and infrastructure — so it can be observed, explained and controlled.
Distributed tracing did this for microservices. AI needs the same shift, but with dimensions traditional APM never had to understand:
- Delegation depth — who handed work to whom, and with what permissions
- Model routing — which model actually processed the request, and why it was chosen
- Policy decisions — what was allowed, warned, redirected or denied
- Risk — how far an operation moved toward the edge of its operating envelope
- Cost and tokens — what each step consumed
- Security boundaries — whether data or actions crossed out of the organisation
- Impact — what the operation changed in applications and infrastructure
Time alone is not enough. An AI trace is multi-dimensional.
Anatomy of an AI trace
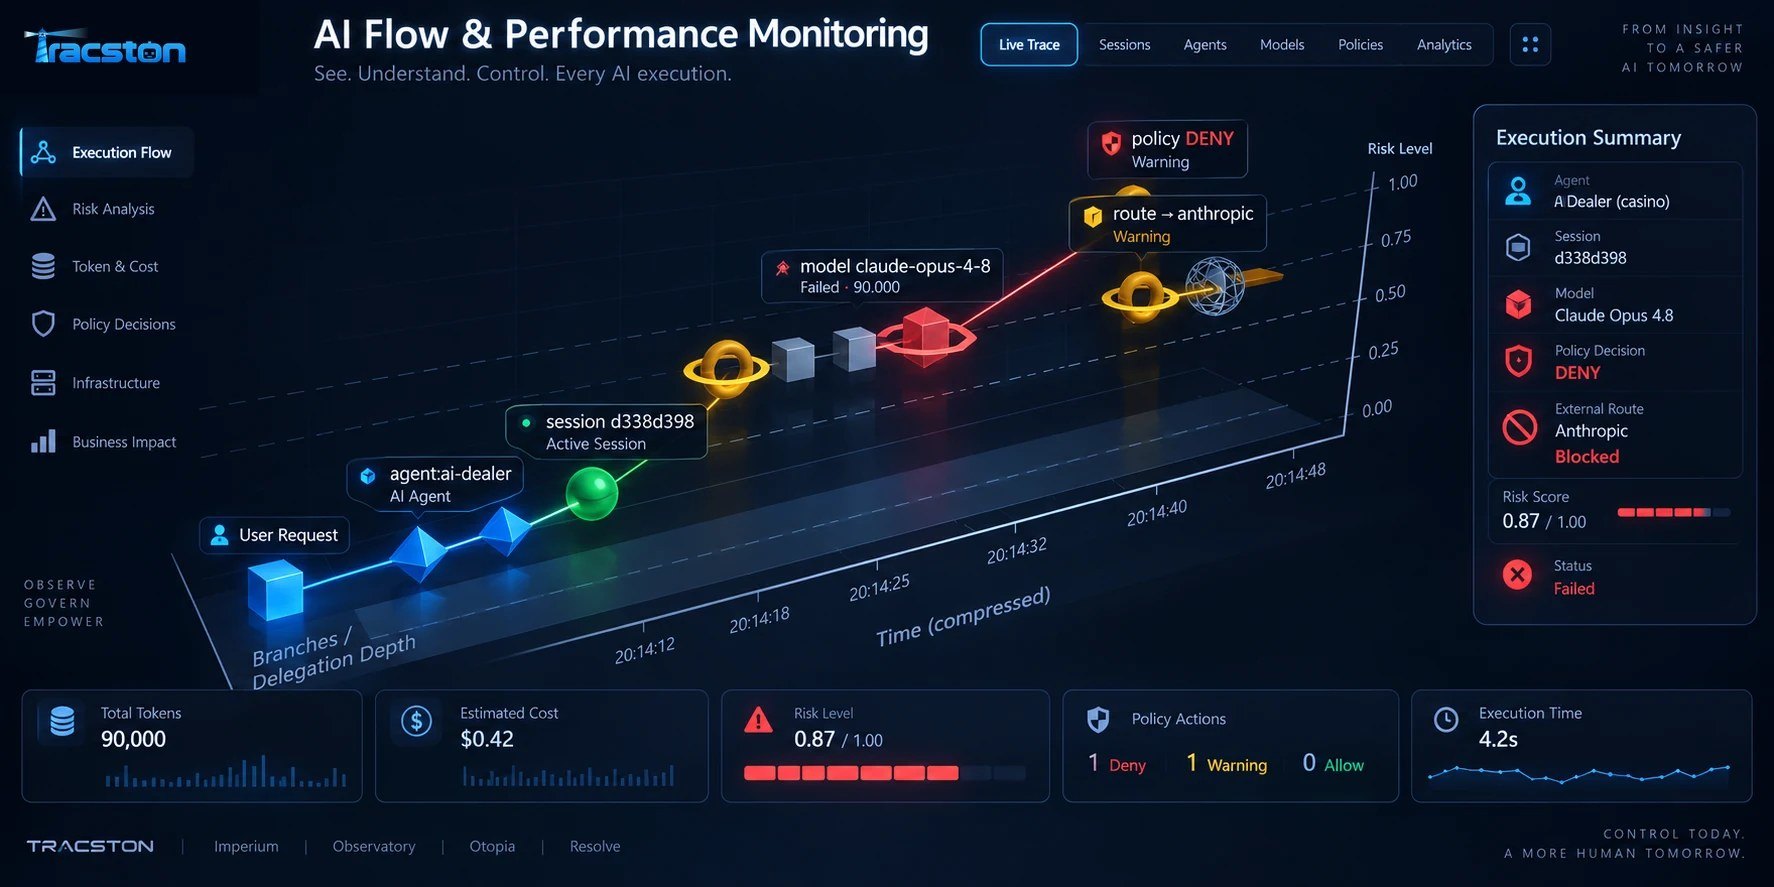
The view above shows a single AI execution reconstructed across three axes — time, risk level and branches / delegation depth:
- User request. A person asks for something — the root of the trace.
- Agent. An AI agent picks up the task and delegates part of it deeper in the chain.
- Session. The work runs inside an identifiable, active session — the unit we can later replay.
- Model call fails. The selected model fails after consuming 90,000 tokens. Risk begins to climb.
- Route change. The system tries to reroute to an external model provider — a warning: data is about to leave the organisation.
- Policy decision. A policy evaluates the new route and denies it. The external route is blocked.
Risk score 0.87 / 1.00, estimated cost $0.42, status failed. In a log file this is a dozen disconnected lines. As a flow it is one readable story: a model failure pushed an agent toward an external route, and governance stopped it — what happened, why, and where the boundary held.
The questions an AI trace must answer
- Which agent initiated this operation, and who delegated it?
- Which model actually processed it, and why was it selected?
- What information was sent?
- Which policies were evaluated — allowed, warned, redirected or denied?
- Did the agent leave its operating envelope?
- Which tools were invoked, and what did it cost?
- What infrastructure did it affect?
And most importantly: can we reconstruct exactly what happened five minutes, five days or five months later?
AI does not live in an isolated “AI world”
An agent modifies code, calls APIs, queries databases, deploys workloads, talks to SaaS systems, consumes GPU and CPU, and changes production. So AI observability cannot stop at the model — it has to connect the whole chain: Human → AI → Agent → Tool → Application → Infrastructure → Business service. That is where AFPM stops being an AI feature and becomes part of the observability stack.
Observability alone is not enough
A dashboard that tells you something is broken is useful. A system that understands the context and helps prevent or resolve the problem is far more useful. That is why Tracston designs observability and control together:
- Imperium — the AI control plane: identity, policy, routing, governance, security boundaries and enforcement. In the trace above, Imperium is what denied the external route.
- Observatory — correlates each MissionFlow with applications, infrastructure, networks and business services.
- Otopia — the workspace where humans and agents actually collaborate and execute work.
The goal is not another pretty AI dashboard. It is to make an increasingly autonomous environment observable, explainable and controllable.
Air traffic control for AI
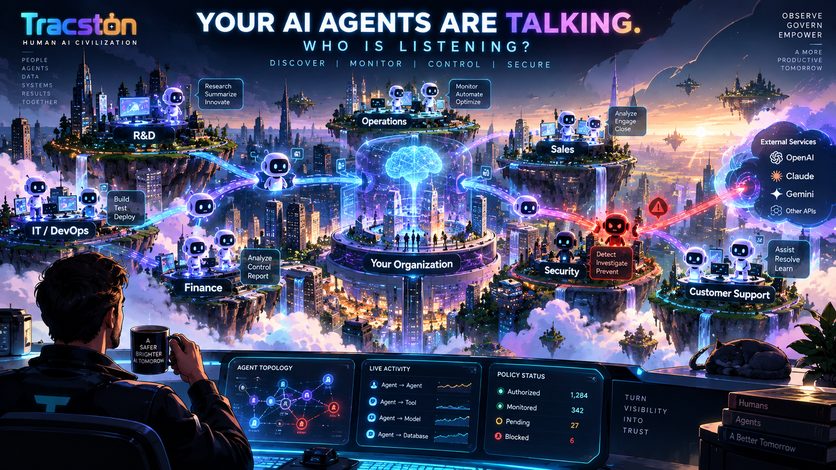
Once organisations run hundreds — eventually thousands — of agents at once, a list of chat sessions will not be enough. You should be able to zoom out to the whole organisation, into a department, follow an agent, open a session, travel back in time, inspect a branch, a policy decision or a delegation, and correlate it with infrastructure. And understand exactly what happened, why, who or what initiated it, what it affected, and what should happen next.
The AI era needs its own observability layer
We are still building this, and some of these ideas will change as we test them in real environments. But one thing already seems clear: we spent decades learning how to observe machines and software. Now we need to learn how to observe autonomous work.
That will become one of the fundamental infrastructure layers of enterprise AI. AFPM is our attempt to start defining what that layer should look like.
Updated October 2026: terminology aligned with MissionFlow. Previously referred to as AI workflows.