Observatory — AI + Infrastructure Observability
The Monitoring World Is Changing: From Data Overload to Operational Intelligence
Most IT teams do not lack information but have too much of it in too many places, and the next step is connecting it into one clear picture of what is wrong and why.
You are driving on the motorway when the dashboard lights up. The battery light comes on. Then the brake warning. Then the power steering light, and a message about the stability system. It looks as if half the car is failing at once. In fact, one small part has worn out: the alternator, which charges the battery. Everything else is a consequence. A good mechanic sees six lights and thinks “one problem”. An anxious driver sees six lights and thinks “six problems”.
Modern IT operations teams face the same situation every day, on a much larger scale.
For years, monitoring systems were built around individual technology layers. Each layer got its own tool, run by its own team.
Network monitoring watched switches, routers and links, the equipment that moves data from place to place. Infrastructure monitoring watched servers, storage and virtualization, the technology that lets one physical computer act as many. APM, or application performance monitoring, focused on applications, measuring how business software behaves and where it spends its time. Log platforms collected events, the running diaries that every system writes about what it did. Security tools watched threats. Cloud platforms added another layer, each with its own monitoring built in.
And now AI agents, model usage and autonomous workflows are creating yet another stream of operational data: which agent did what, which AI model was used, how much it cost and what it changed.
The result is not a lack of visibility. It is often the opposite.
Too much visibility, spread across too many systems.
An operations team investigating a problem may need to open six different platforms just to understand what happened. Each has its own login, its own screens and its own way of naming things. The same server may have a different name in each.
A slow application may appear as:
- increased latency in APM, meaning users are waiting longer for pages and actions;
- CPU pressure on a virtual machine, meaning a computer is working flat out;
- packet loss on a network segment, meaning some data is getting lost in transit and has to be sent again;
- database waits, meaning requests are queuing for the database;
- a burst of error logs, as software records that things are failing;
- a failed deployment, a software update that did not go as planned;
- and repeated retries from an AI agent, which keeps trying a step that keeps failing.
Each system sees one piece of the incident. The real challenge is understanding how those pieces relate. Like the car’s warning lights, seven signals may be describing a single problem.
That is where modern observability is changing.
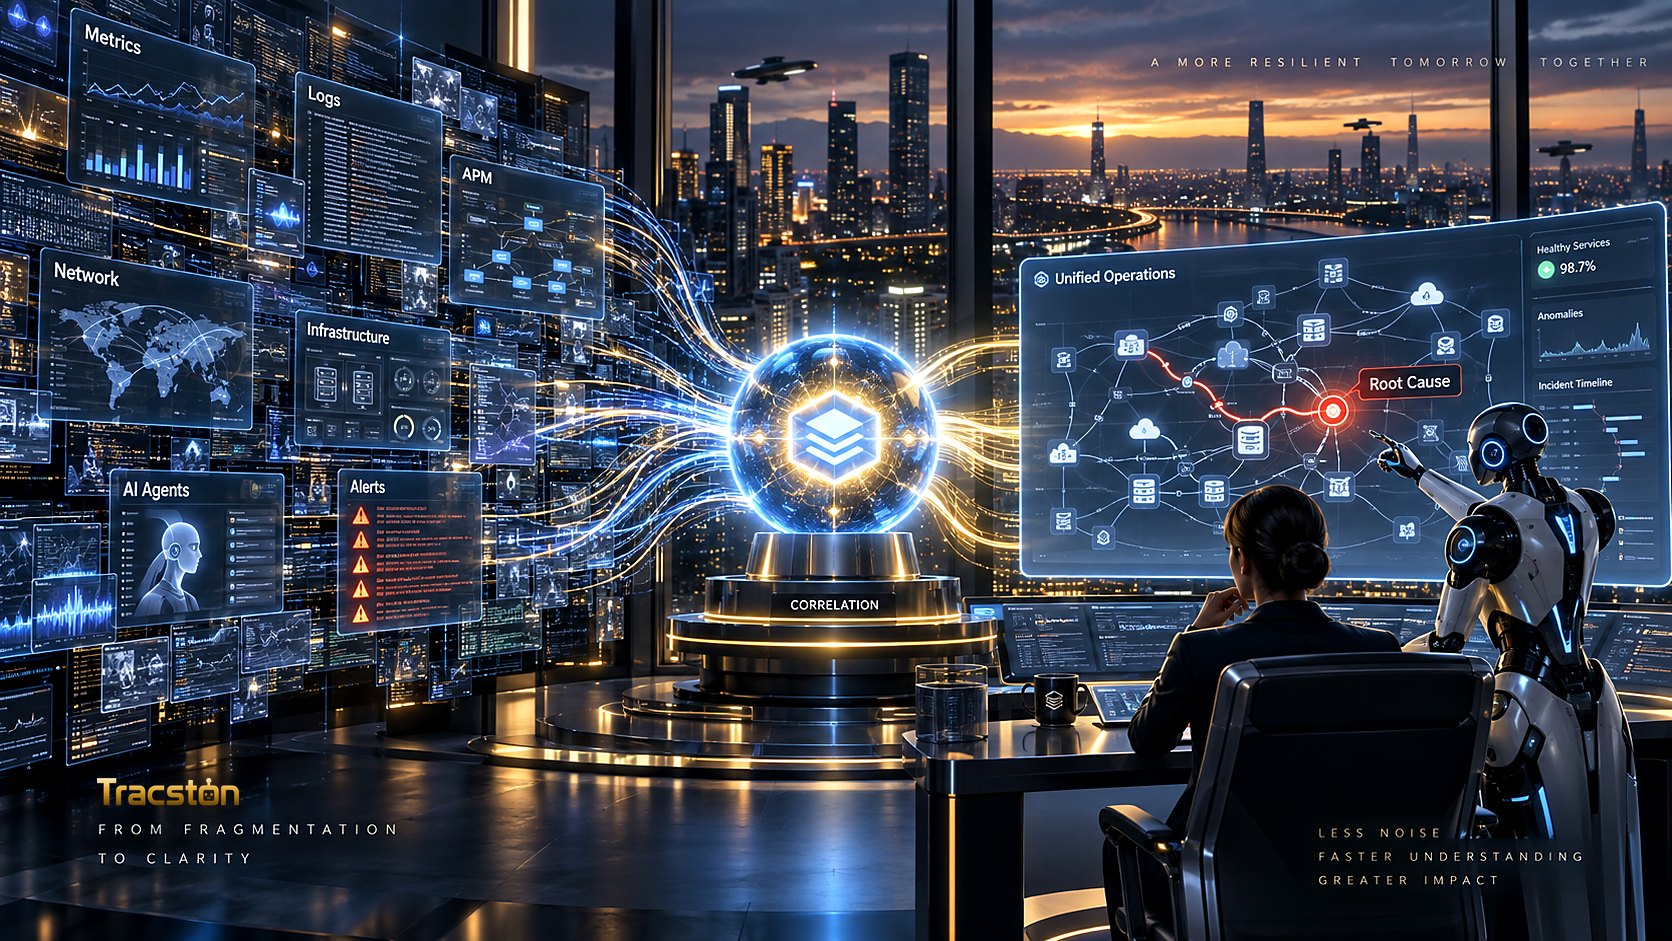
The next generation of monitoring platforms must move beyond dashboards and alerts. Dashboards show numbers. Alerts announce that a number has crossed a line. Neither explains anything. They need to create operational context: an understanding of how signals, systems and events belong together.
Instead of presenting thousands of independent signals, the platform should understand that several events belong to the same service, the same dependency chain, the same change or the same incident. A dependency chain is the line of systems that rely on each other: the website depends on the application, which depends on the database, which depends on the storage.
This enables something far more valuable than another alert:
correlation.
Correlation can link events across layers that are normally watched by different teams:
- A database slowdown can be connected to application latency.
- Application latency can be connected to agent retries.
- Agent retries can be connected to higher token consumption.
- Higher token consumption can be connected to a customer-facing delay.
Now the organization is no longer looking at isolated telemetry. It is looking at a story.
From Alert Management to Root Cause
Traditional monitoring often tells engineers what is failing. Modern operations need to explain why.
If ten services generate alerts because one shared database has failed, creating ten incidents does not help. It sends ten people in ten directions. The useful answer is:
One database issue is affecting ten dependent services.
This is the beginning of root-cause analysis. Topology, dependency mapping, logs, traces, metrics, changes and AI activity can all contribute to that conclusion. Topology and dependency mapping describe which systems rely on which. Traces follow single requests across systems. Metrics are the numbers systems report over time. The record of recent changes shows what was different today.
The objective is not to eliminate the raw data. Engineers will still need the details when they dig in. It is to transform raw telemetry into a smaller number of meaningful operational events. That reduces noise and saves one of the most expensive resources in IT:
human investigation time.
One Operational Picture
Centralization does not necessarily mean replacing every specialized tool. Organizations may continue using different collectors, cloud platforms, databases and monitoring technologies. Each of those tools often does its own job very well, and replacing them all would be expensive and disruptive.
The important change is creating a common operational layer above them. A layer is simply a level that sits on top of the others and brings their information together, without taking their place.
A single place where teams can answer:
- What is affected?
- When did it start?
- What changed?
- Which systems depend on it?
- Which users or business services are impacted?
- What happened immediately before the incident?
- Have we seen the same pattern before?
- What is the most likely root cause?
Instead of engineers manually moving between systems and reconstructing the incident, the platform performs much of that correlation automatically.
Why This Matters Even More for AI Agents
This change becomes especially important as AI agents begin participating in operations. An agent can investigate infrastructure much faster than a human, but only if it has access to the right context.
Giving an agent millions of unrelated metrics and log lines is not intelligence. It is the six warning lights again, only faster. Giving it a correlated operational model is. An operational model is an organized understanding of the environment: what exists, what depends on what, and what has happened.
If the platform already understands service relationships, infrastructure dependencies, historical incidents, recent changes, logs and performance metrics, an agent can ask much more useful questions. Instead of: “Which alerts are active?” it can ask: “What changed in the payment service before latency increased?” Or: “Which shared dependency explains the failures across these five services?” Or: “Has this failure pattern occurred before, and what resolved it?”
This transforms AI from a simple alert summarizer into an operational investigator. The difference is the same as between someone who reads out the warning lights and a mechanic who knows how the car is built.
What this means for your organization
Count your screens. Ask your operations team how many tools they open during a typical incident. The number is a direct measure of how much correlation is being done by hand.
Measure the first hour. For your last few serious incidents, find out how long it took to identify the root cause, and how much of that time was spent gathering information rather than fixing anything.
Build the dependency map. Make sure someone keeps an up-to-date record of which systems depend on which. Correlation, by people or machines, starts there.
Put changes next to alerts. Make recent changes, including those made by AI agents, visible in the same place as alerts. “What changed?” is often the fastest route to the cause.
Include AI activity. Treat the actions and costs of AI agents as part of your operational data, not a separate report.
The Future Is Less About Collecting More Data
Organizations will continue collecting more telemetry. More infrastructure, more services, more logs, more traces, more security events and more AI activity will all add to the stream.
The solution cannot simply be more dashboards. The real opportunity is to build systems capable of understanding relationships across all of that information.
The future of monitoring is therefore not just observability.
It is operational intelligence.
- Collect the signals.
- Connect the signals.
- Understand the impact.
- Identify the likely cause.
- Give humans and AI agents the context required to act.
Tracston works on these questions in Observatory.