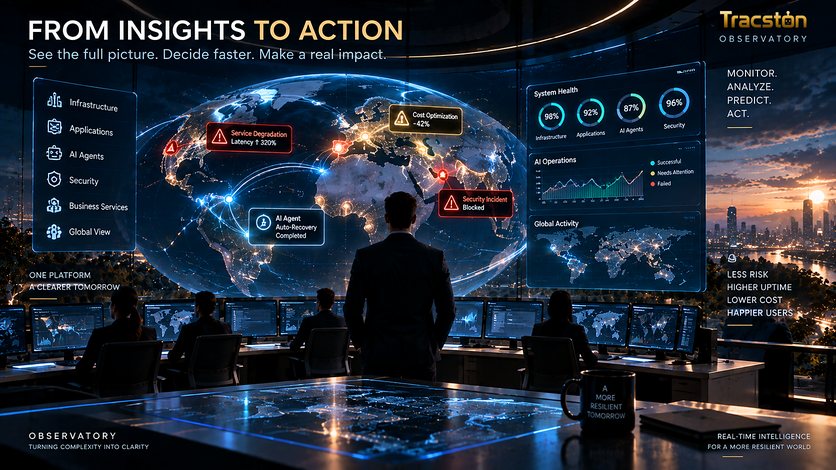
Observatory — AI + Infrastructure Observability
AI Monitoring Cannot Live in a Separate Universe
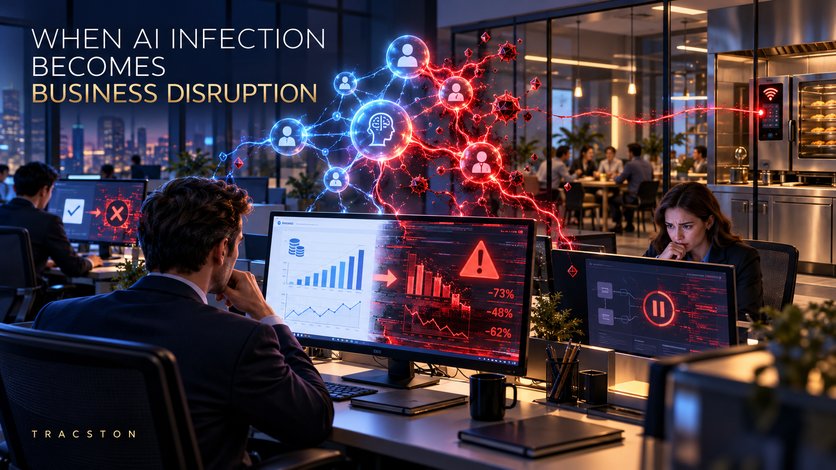
When AI slows down, the cause is often a database, network or service underneath it, so AI monitoring has to be connected to everything else.
Your train is running twenty minutes late. The passengers look at the driver, because the driver is the person they can see. But the driver is doing everything right. The real cause is a signal failure two stations back, a problem with the track, not the train. Blaming the driver would not get anyone home any faster. Only someone who can see the whole line can tell what actually went wrong.
AI systems have their own version of this problem.
The rise of the AI dashboard
Many organizations are building dedicated AI dashboards. They track token usage, the amount of text their AI reads and writes, which is also what they pay for. They track prompt latency, how long the AI takes to answer. They track model costs and agent activity, what their AI agents are doing and how often.
These metrics are useful, but they tell only part of the story. They are the view from the driver’s cab.
AI systems still depend on traditional infrastructure. Every AI feature sits on top of the same layers of technology as any other software, and each layer can slow it down or stop it:
- Networks
- The connections that carry data between systems.
- Databases
- Where the organization’s information is stored and searched.
- Containers and virtual machines
- The packaged, rented or shared computers that the software actually runs on.
- Storage
- The disks and services that hold files and data.
- APIs
- The connections through which one piece of software asks another for something.
- Applications
- The business software the AI is part of.
- Message queues
- Waiting lines that hold work until the next system is ready for it.
- Cloud services
- Everything rented from outside providers.
An AI agent that answers a customer question may touch most of these in a few seconds. If any of them has a bad moment, the AI appears slow.
When the AI is not the problem
When an AI process slows down, the model may not be the problem. The model is the AI engine itself, and it is often the first thing blamed. But look at what else might be happening.
Perhaps vector search became slow.
Perhaps the database is saturated, meaning it is receiving more requests than it can handle, so everything queues. Perhaps an API dependency is failing: a service the AI relies on, such as a customer records system, is returning errors. Perhaps network latency increased, so every message between systems takes a little longer, and those small delays add up. Perhaps an agent is retrying because a backend service is unavailable. A backend service is a system that works behind the scenes. If it does not answer, the agent tries again, and again, and each attempt adds time and cost.
In every one of these cases, an AI dashboard would show the same thing: the AI is slow. It cannot show why.
This is why AI monitoring should not become an isolated observability silo.
A silo is a separate store that does not connect to the others. Observability is the ability to understand what is going on inside systems from the signals they produce. An observability silo is a set of signals that can only be understood on its own, and so cannot explain problems that start somewhere else.
Connecting the layers
The AI layer needs to connect with the monitoring the organization already has. Most organizations have been building that monitoring for years:
- Infrastructure monitoring
- Watches servers, storage and networks.
- Application performance monitoring (APM)
- Measures how business software behaves and where time is spent inside it.
- Distributed traces
- Follow one request as it moves across many systems, step by step, with timings.
- Logs
- The running diary each system keeps of what it did.
- Service topology
- A map of which systems depend on which. If this one fails, what else is affected?
When the AI layer is connected to these, an AI request stops being a single number and becomes a story with parts. Instead of seeing: “AI request latency: 18 seconds”, an engineer should be able to understand where those 18 seconds went:
- The agent spent two seconds reasoning.
- A database query consumed nine seconds.
- An external API timed out.
- The agent retried.
- The final model response took three seconds.
Now the problem becomes actionable. Actionable means someone knows what to do next and who should do it. The database team can look at the query. The integration team can ask why the external service timed out. The AI team can stop searching for a problem that was never theirs.
What this means for your organization
Ask where your AI metrics live. Are they in the same place as your other monitoring, or in a separate tool that only the AI team looks at?
Map what your AI depends on. For your most important AI process, list every database, service and system it touches. That list is the part of the stack your AI monitoring needs to see.
Break down one slow request. Next time someone says the AI is slow, ask for a step-by-step breakdown of where the time went before anyone changes the model.
Bring the teams together. Invite the AI team into the regular operations review, and the infrastructure team into AI reviews. Many problems sit between them.
Use one reference number. Make sure each AI request carries an identity that appears in the logs and traces of every system it touches, so its path can be followed.
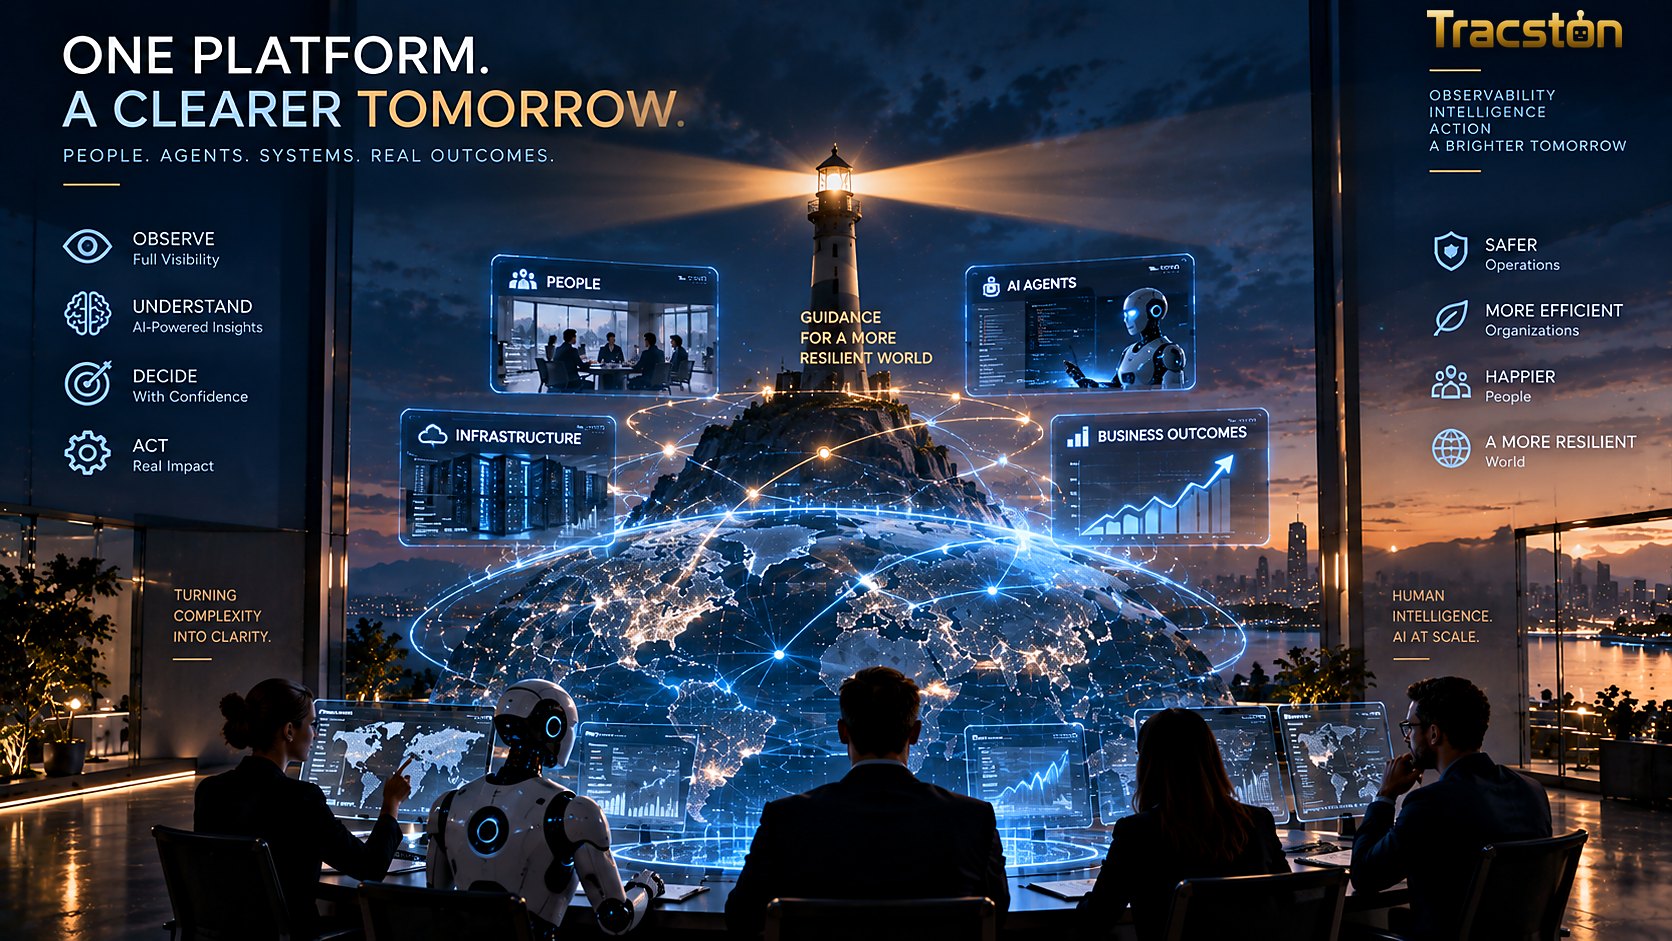
Tracston works on these questions in Observatory.