
Agent Execution Tracing
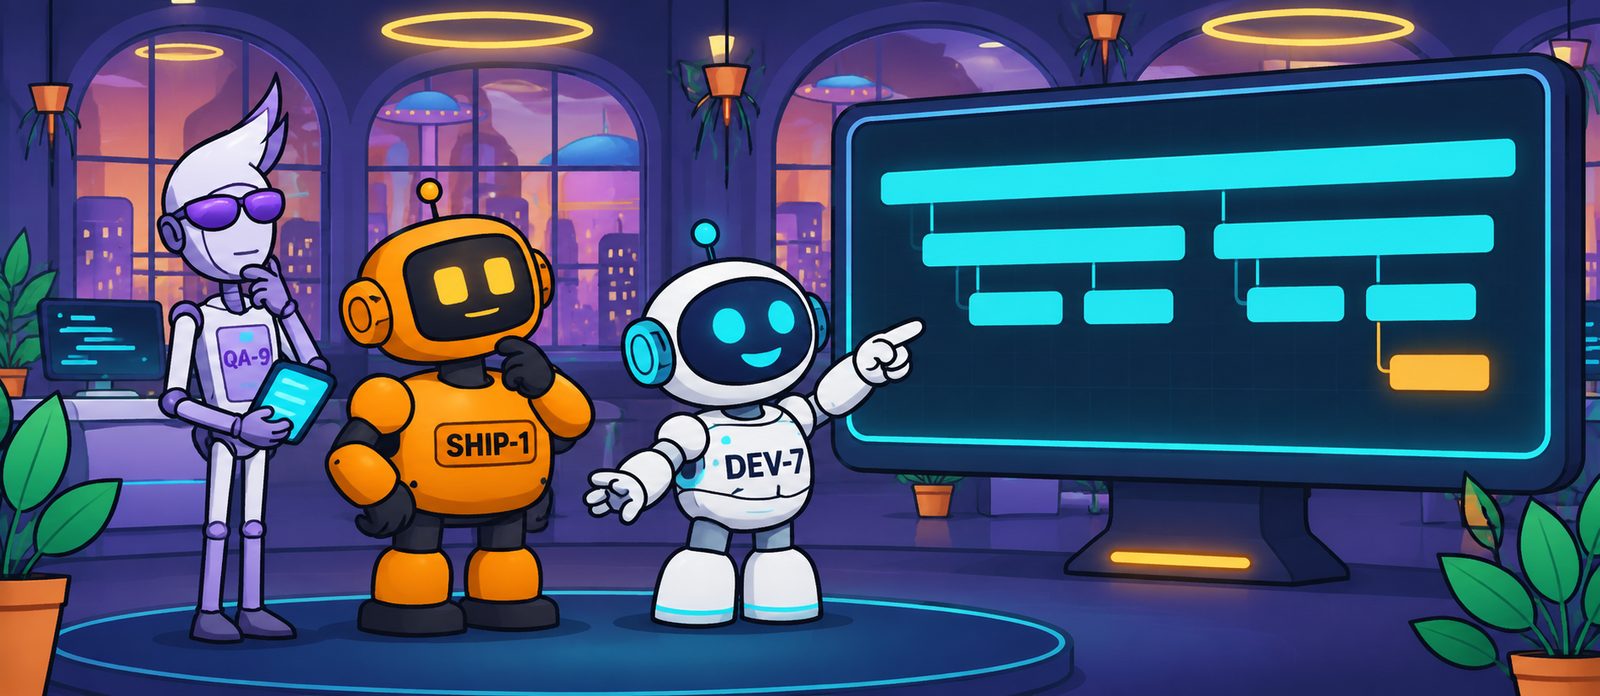
Agent execution tracing records each step an agent takes (model calls, tool calls, delegations, decisions and their results) as linked spans in one trace, so a whole run can be reconstructed in order, with timing, cause and effect.
Distributed tracing was built for microservices. In OpenTelemetry’s model, a trace is a tree of spans; each span has a name, start and end times, attributes, a status, and a reference to its parent. Following the tree shows where a request went and where its time was spent.
An agent run fits the same model, with two differences. The tree is built at runtime and may differ on every run. And the useful attributes are new ones: which agent and identity acted, who delegated to it, which model and tools it used, which policy decision applied, what it cost, and which attempts were retries.
How it works
- One trace per run. A root span for the task or mission; child spans for each model call, tool call and sub-agent.
- Context propagation. The trace identifier and parent span travel with every call. Across HTTP, W3C Trace Context does this with the traceparent header. Between agents and tools, the same context has to be carried in headers, message metadata or the tool protocol, or the trace breaks into pieces.
- Agent-aware spans. The OpenTelemetry semantic conventions for generative AI, still marked as in development, describe spans such as invoke_agent and execute_tool.
- Links for asynchronous work. Work that resumes later, from a queue or after an approval, can be connected with span links.
- Sampling and redaction. Keep the runs that failed or were unusual, and avoid storing sensitive inputs verbatim.
Example
An agent collects supplier invoices from portals. Its trace reads:
Mission: collect this month’s invoicesCollector agentPortal login: timeoutRetry: timeoutPolicy: alternative channel allowedEmail requestValidator agentReport verified
Without propagated context, the email service would record an unrelated request, and the two timeouts would sit in a different log with no link to the mission. With it, one view shows where the time went and why the path changed.
Common misconceptions
- “Logs are traces.” Logs record events. Unless they share trace and span identifiers, they do not record which event caused which.
- “A chat transcript is a trace.” A transcript shows messages. It does not show tool side effects, timing, identities or policy decisions.
- “Trace everything verbatim.” Prompts and tool results can contain secrets and personal data; record references or redacted values where possible.
Operational implications
Debugging and incident response. Traces turn a set of disconnected log lines into one sequence.
Governance. A trace with identities and decisions is evidence of what an agent did and under which authority.
Cost. Per-span token and tool costs let cost be attributed to the step and the attempt that caused it.
Overhead. Instrumentation and storage have a cost; sample deliberately.
AFPM builds on execution traces and adds the mission, policy decisions and cost to them.
Related
- Agent Identity
- Agent Authorization & Approval Gates
- AI Flow & Performance Monitoring (AFPM)
- When a MissionFlow Fails, Where Do You Start Looking?
- The Next Generation of Observability Will Follow Decisions, Not Just Requests
- Your AI Agents Are Talking to Each Other. Who Is Listening?
- Who is watching the AI? Introducing AFPM
- MissionFlow Simulation: A portal fails, the supervisor picks a permitted alternative and the report is verified.